PROCESS

Process Timeline
— Process 1 of 4 —
Emphasize
User Research
Aside from online research, I led the stakeholder meeting and baseline testing to get a better understanding of the product and users.
Stakeholder meeting: To obtain a solid knowledge of the product, business goals, and user cases, I interviewed the Chief Product Officer, Dave, who has been closely working with the engineers, Sales team, and customers.
Baseline study: Due to time constraints, I executed six 40-minutes meetings, which covered user interview and usability testing, in a week to:
- Set user performance measures prior to any design changes
- Understand users’ behaviors and needs
- Identify potential design concerns
Based on user interviews, I was able to outline three different user personas as a reference for the following design: (1) the chief technical officer who works at a startup, (2) the inventor at a giant company, and (3) the product manager.


For the usability testing, I listed out six tasks with scenarios for participants to complete. The task completion task was 34% on average which helped me establish the baseline measurement for the future design changes.
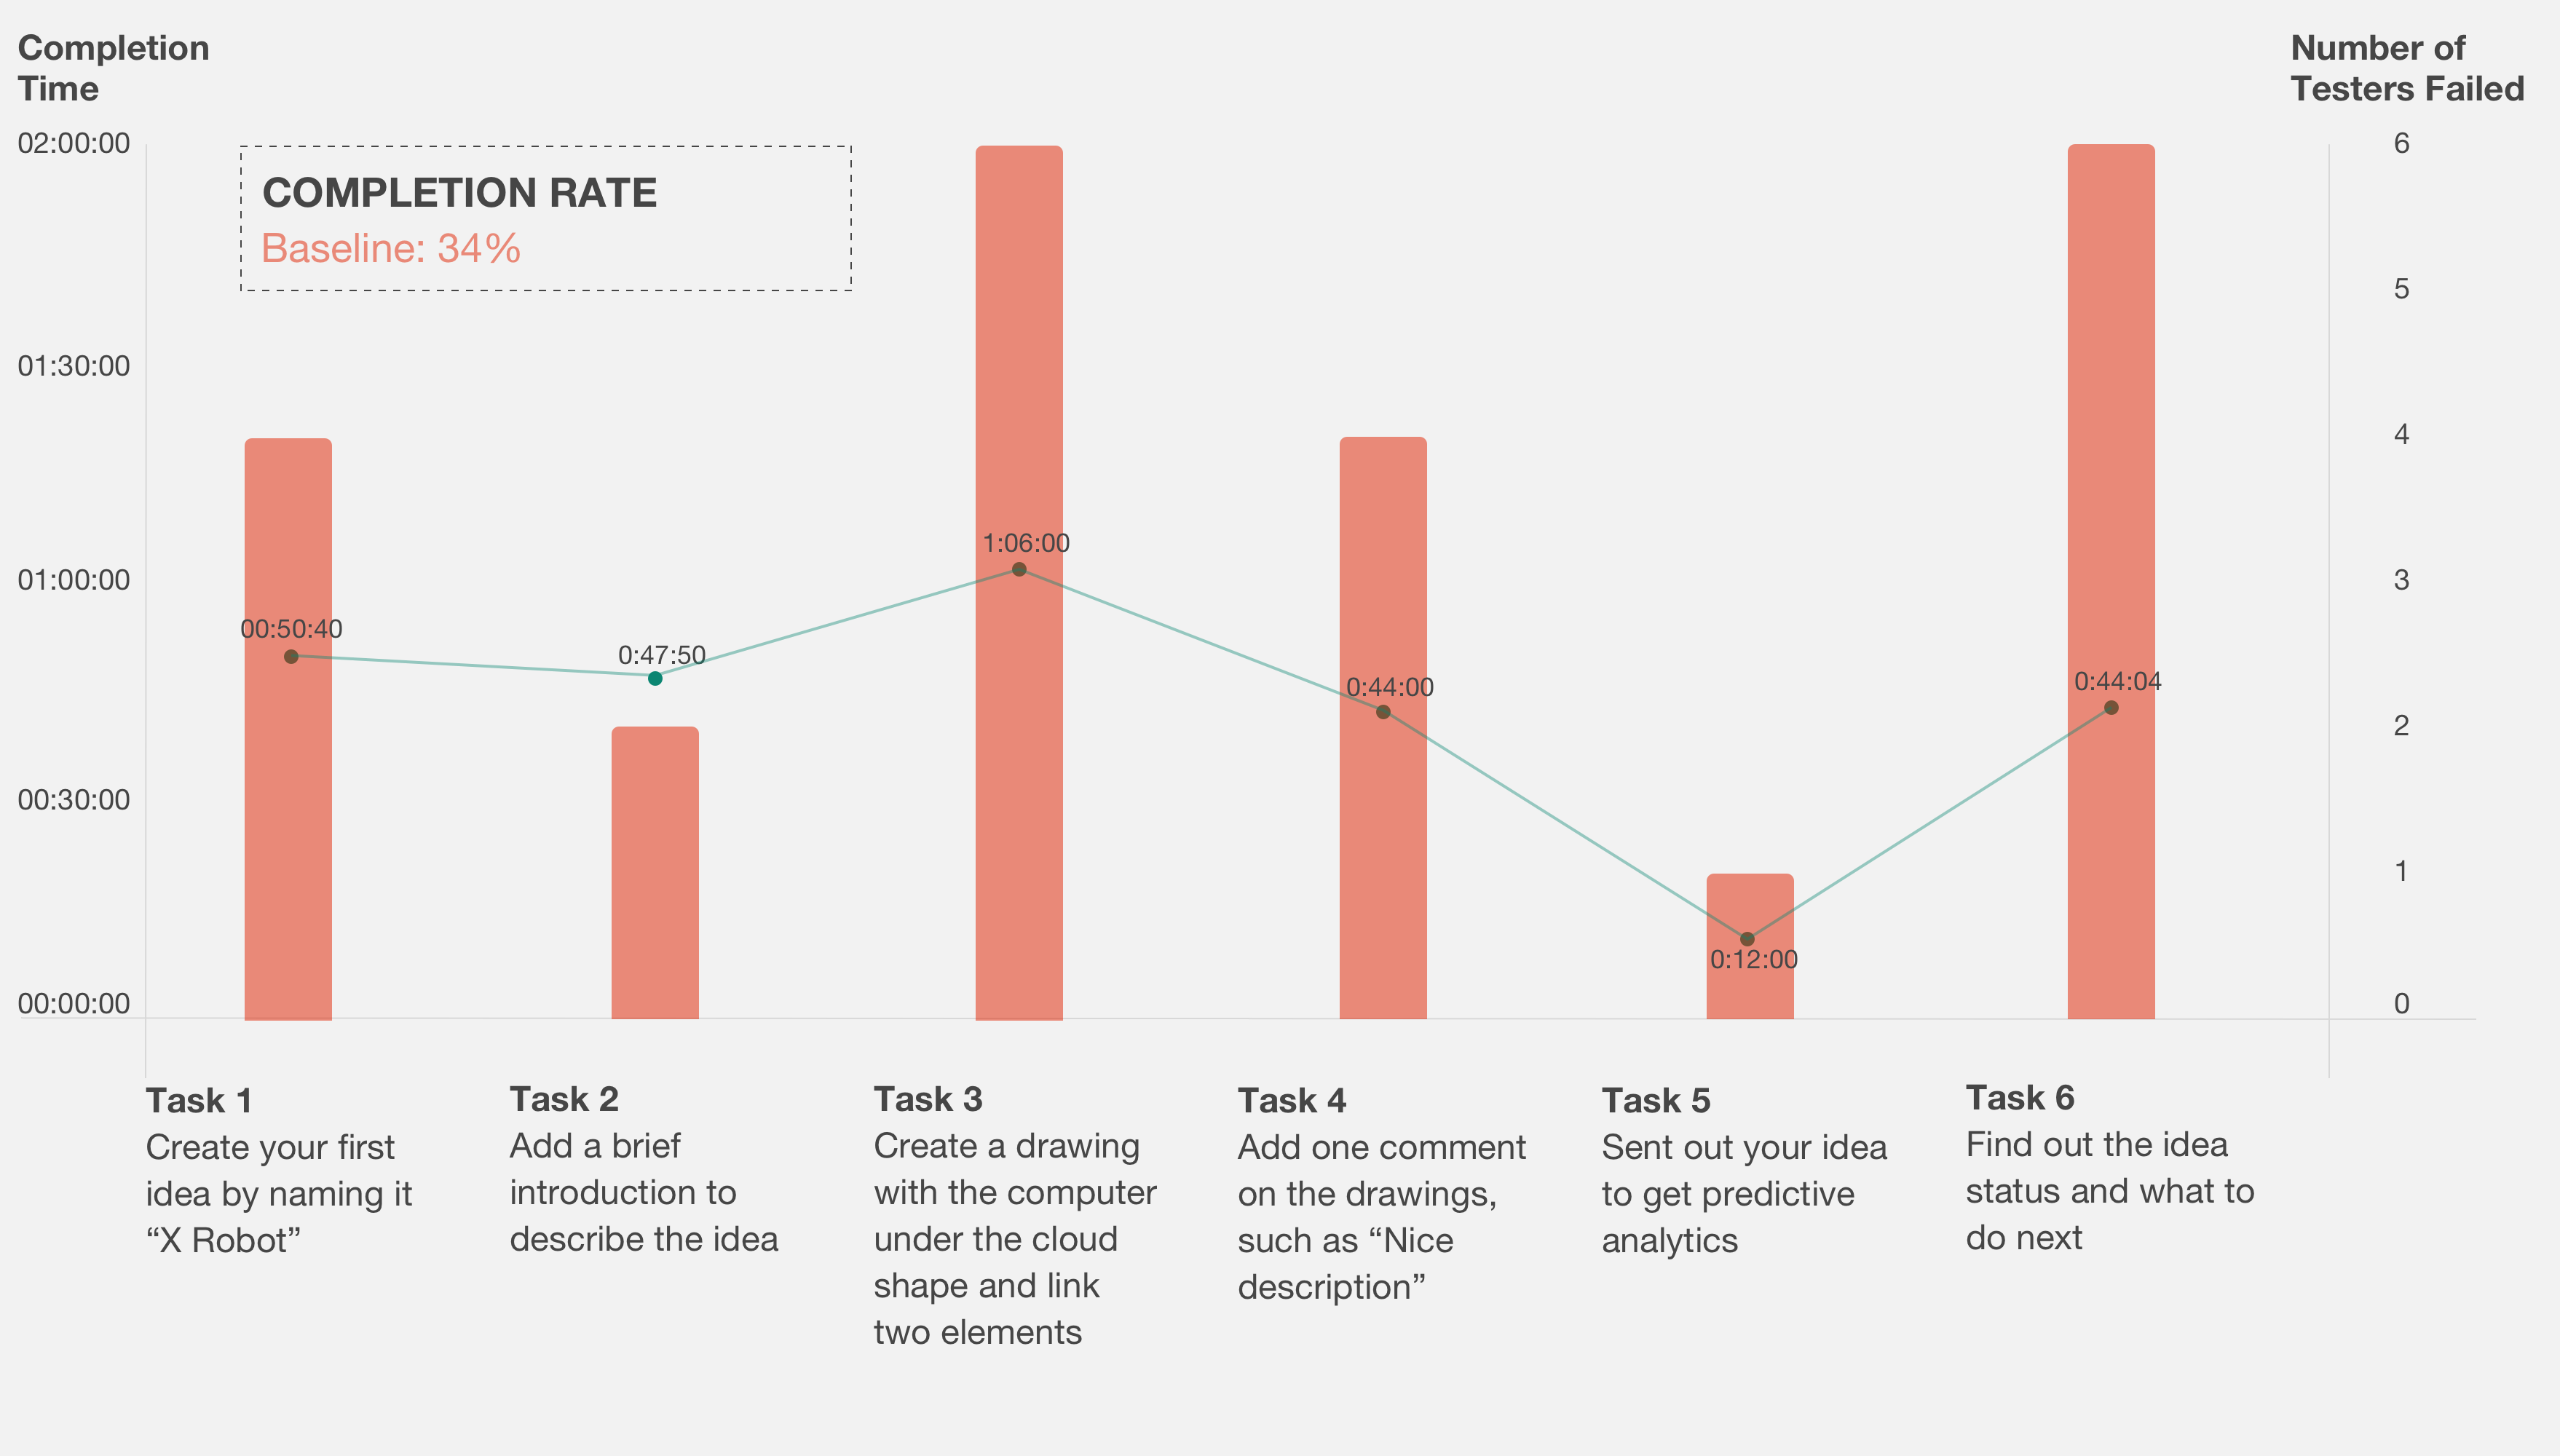
Image: Result of scenario-and-task testing
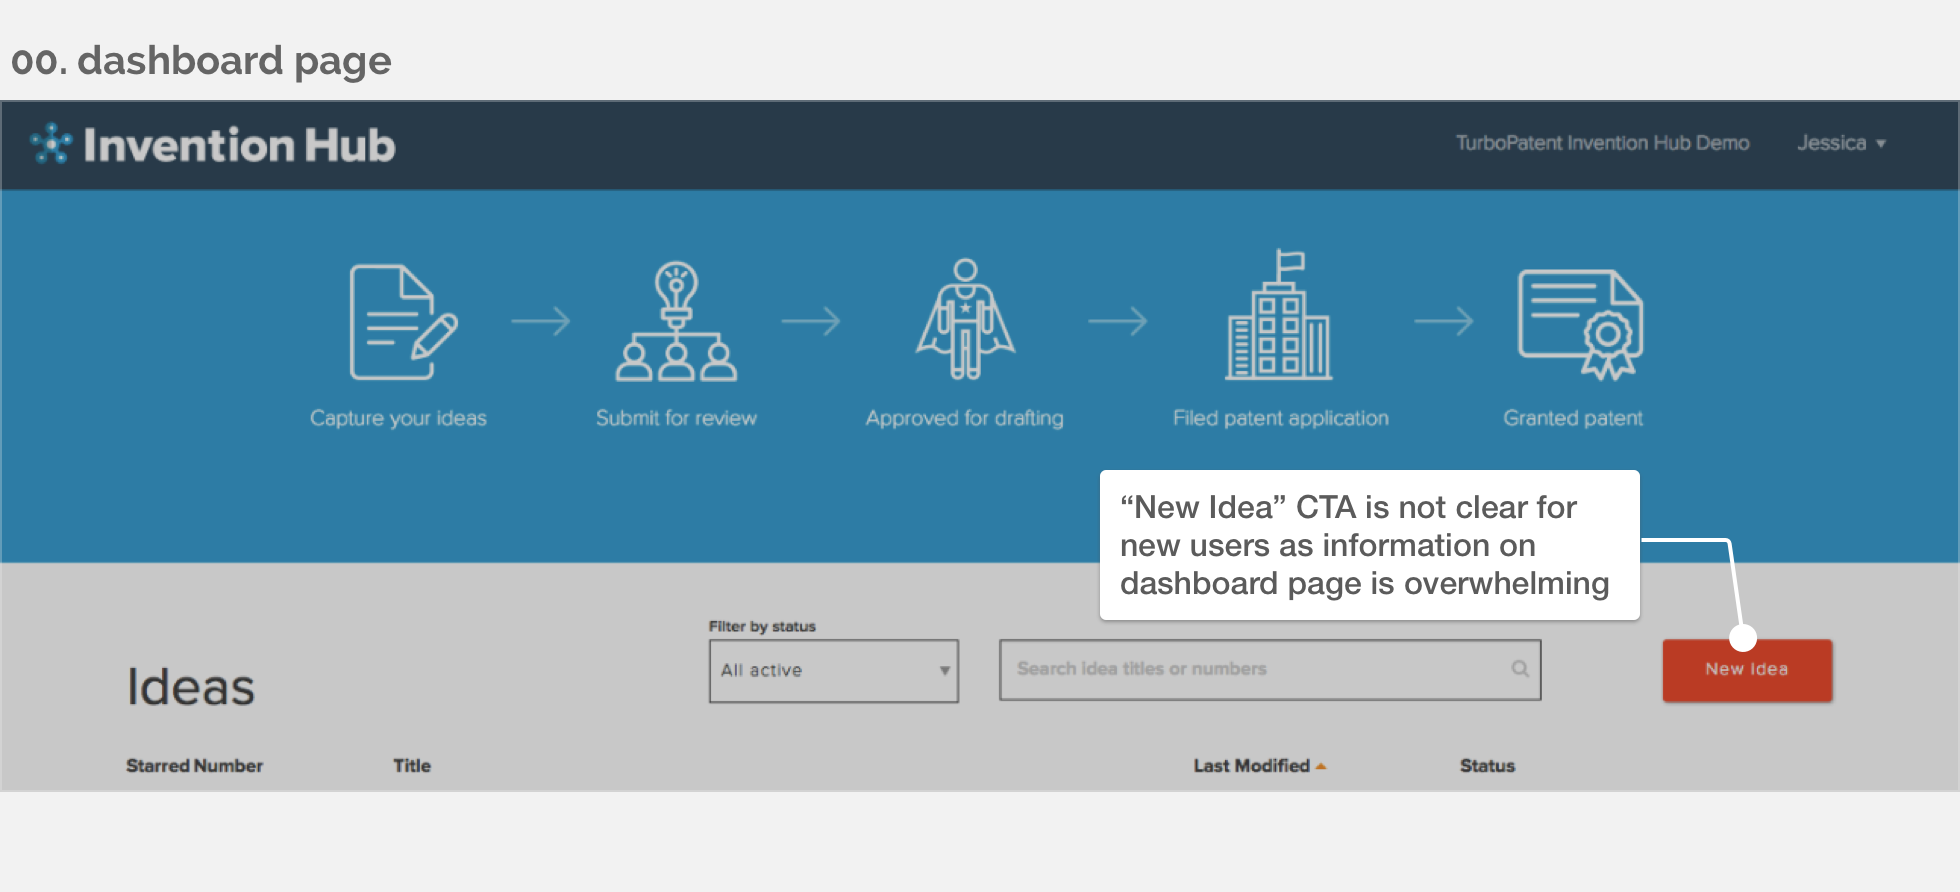
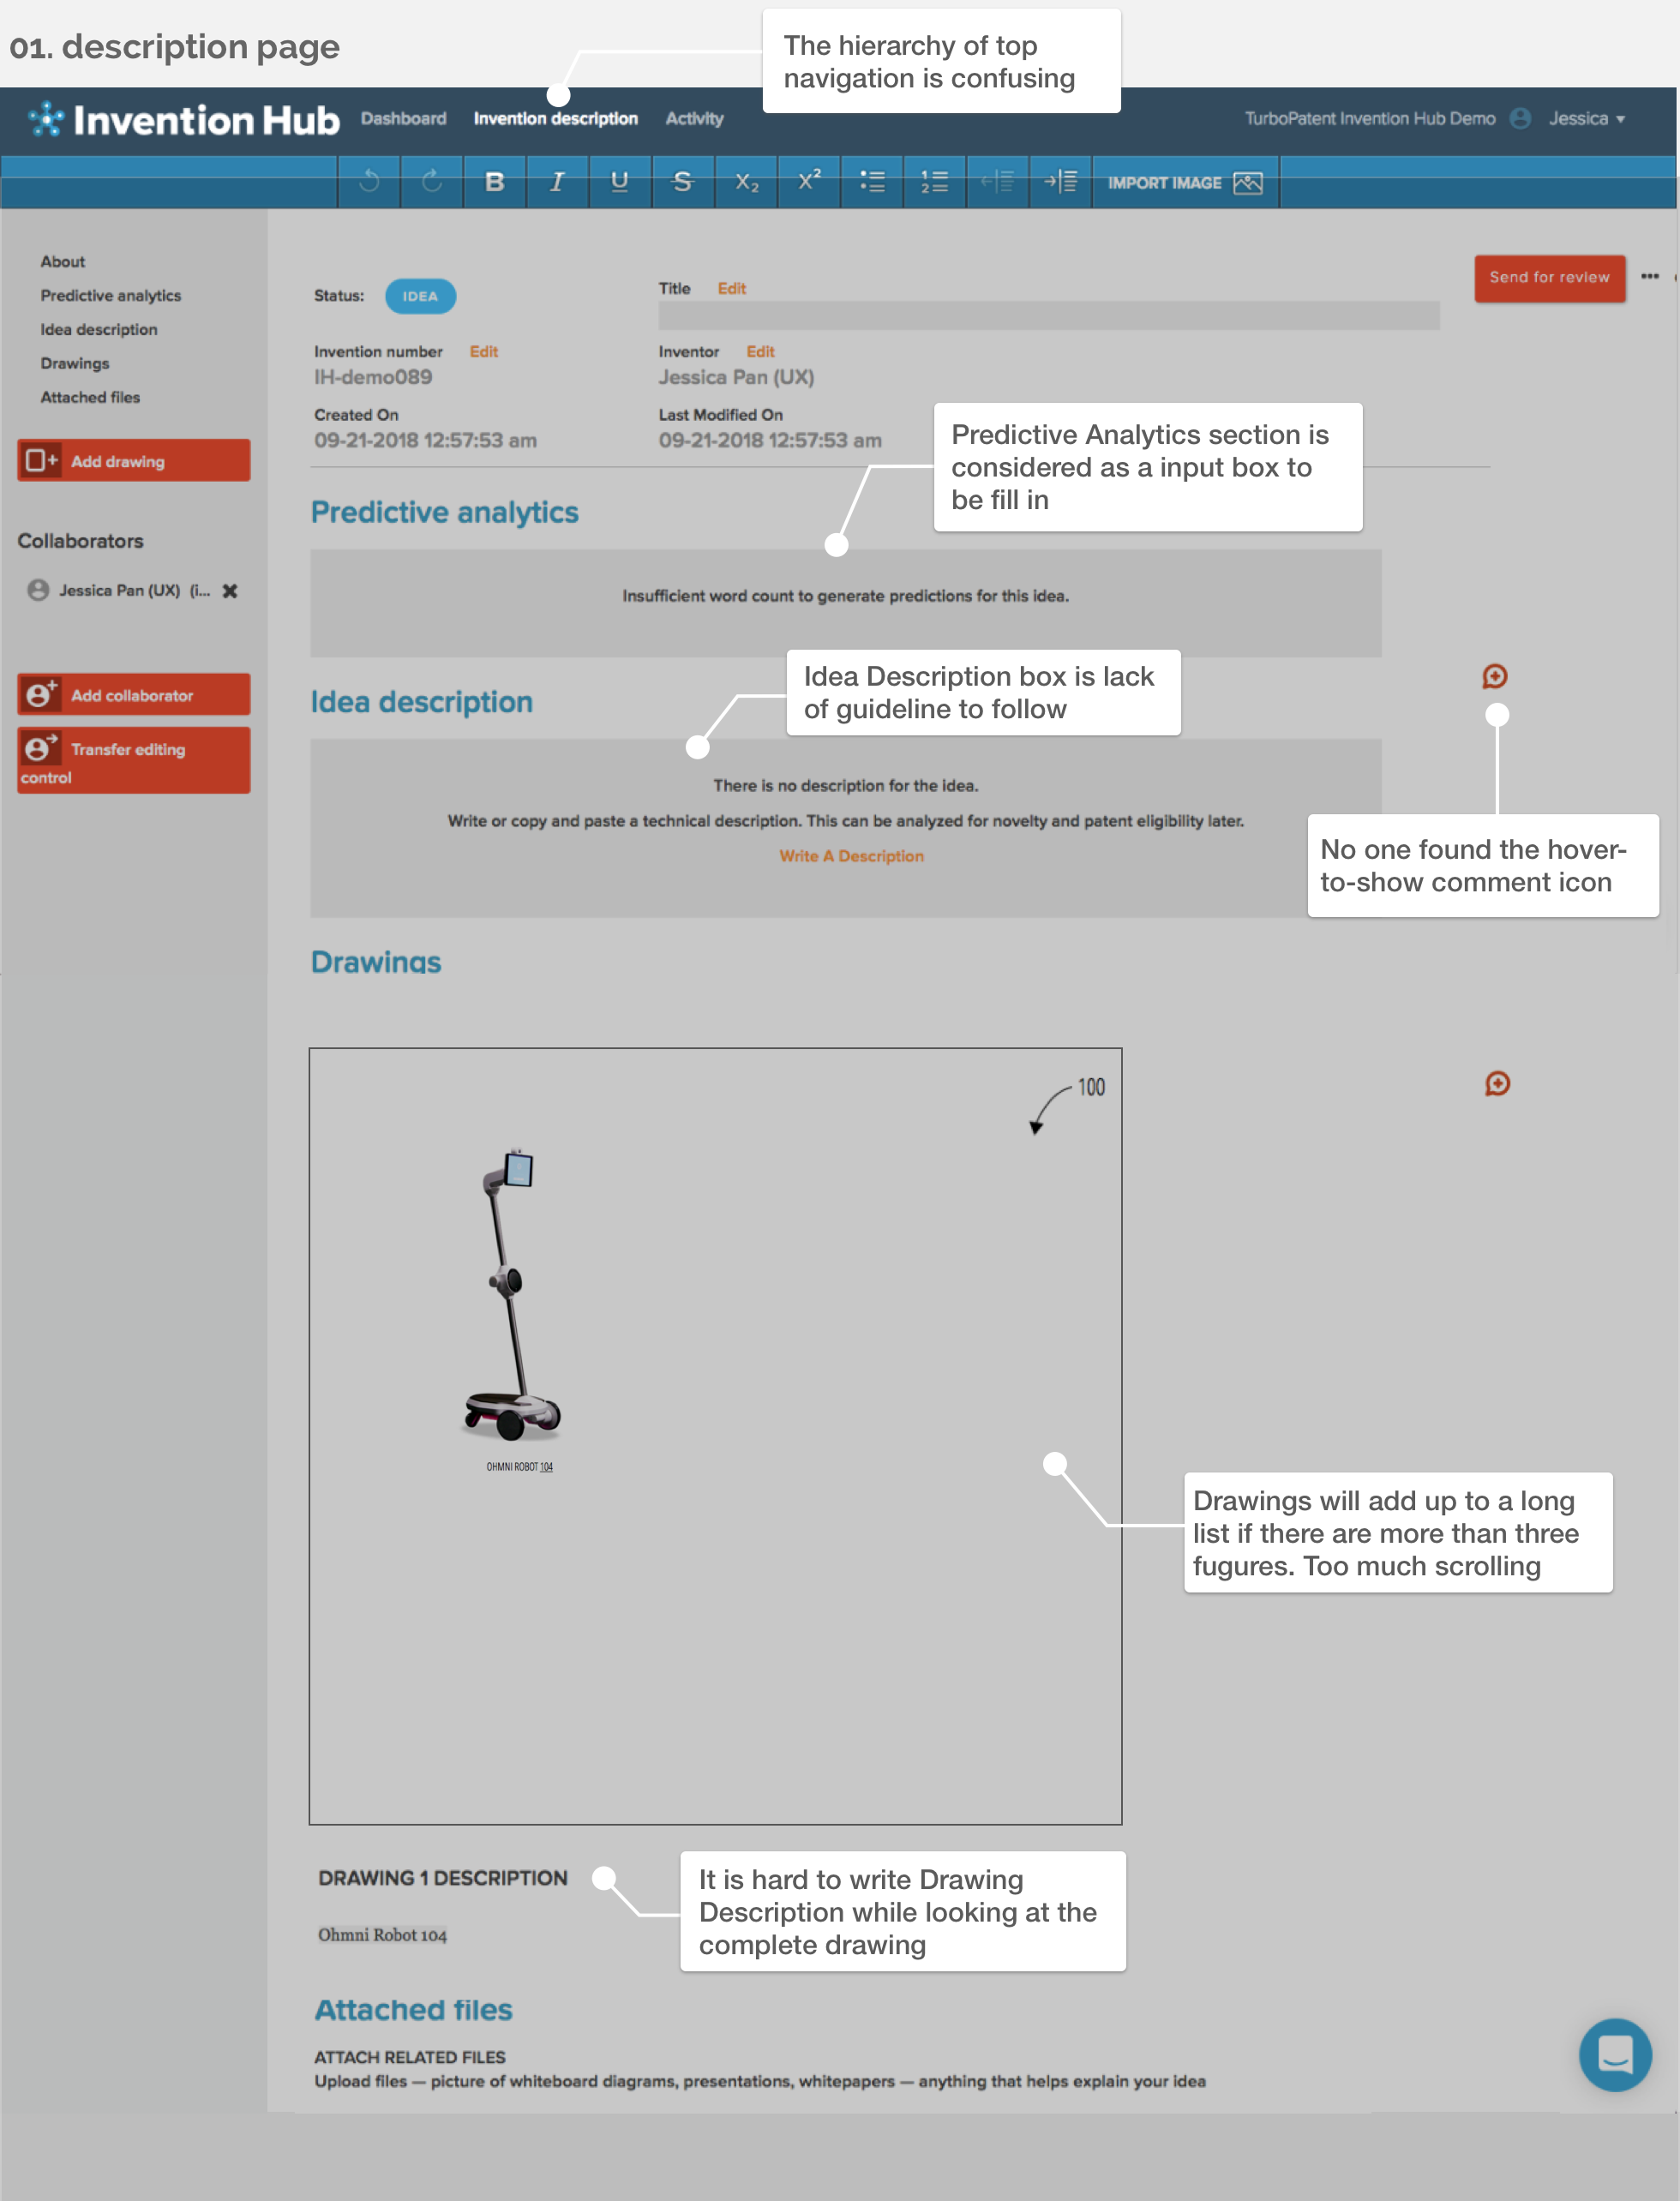
The design problems on the three key pages- Dashboard, Description, Drawing Tool page- were listed out based on the participants feedback.

— Process 2 of 4 —
Define
Reframe Project Scope
By conducting the Affinity Diagram, I defined the project to solve the existing design problems.
Affinity diagram: I used the Affinity Diagramming to divide the problems into four categories: Navigation, Data Entry, Drawing, and Collaboration.
I then scoped the project based on the severity level to focus on:
- How to create an easy-to-use idea capturing form?
- How to build a more friendly collaboration working space?
- How to optimize the drawing tool?

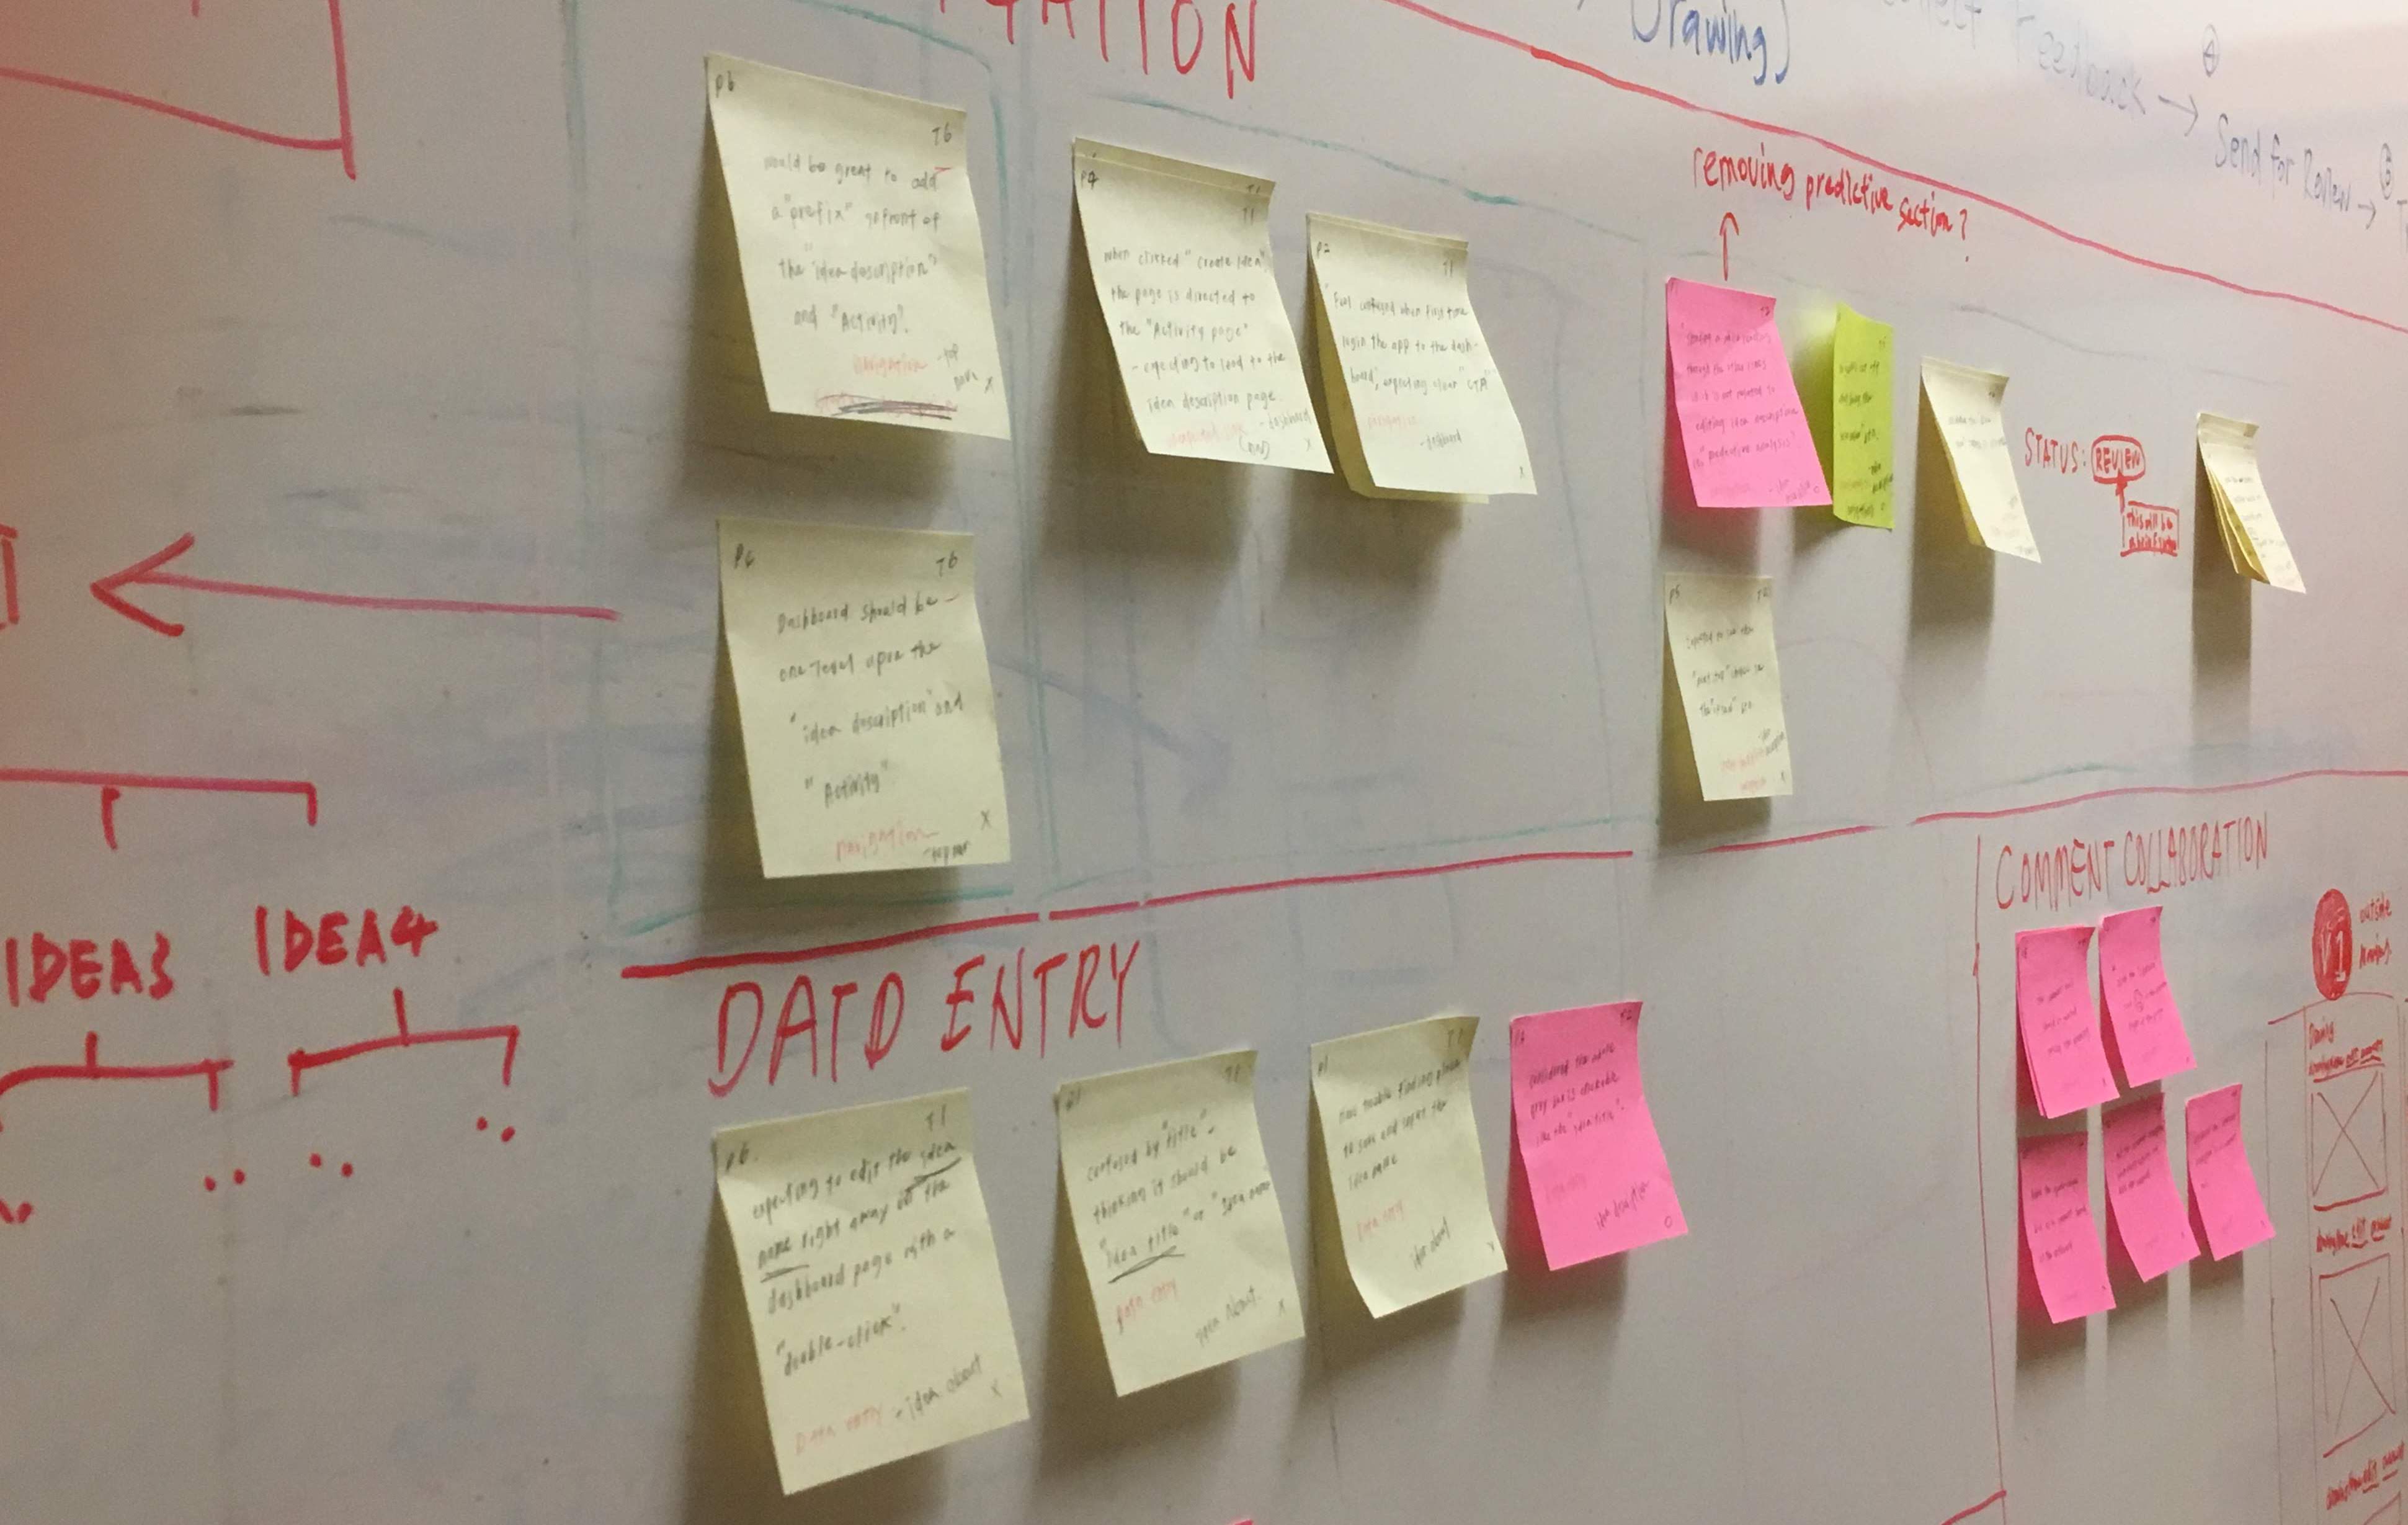
Image: Affinity Diagram Exercise
— Process 3 of 4 —
Ideate
Information architecture: I re-organized and sketched the existing information architecture based on users' feedback.

Information Architecture: Before
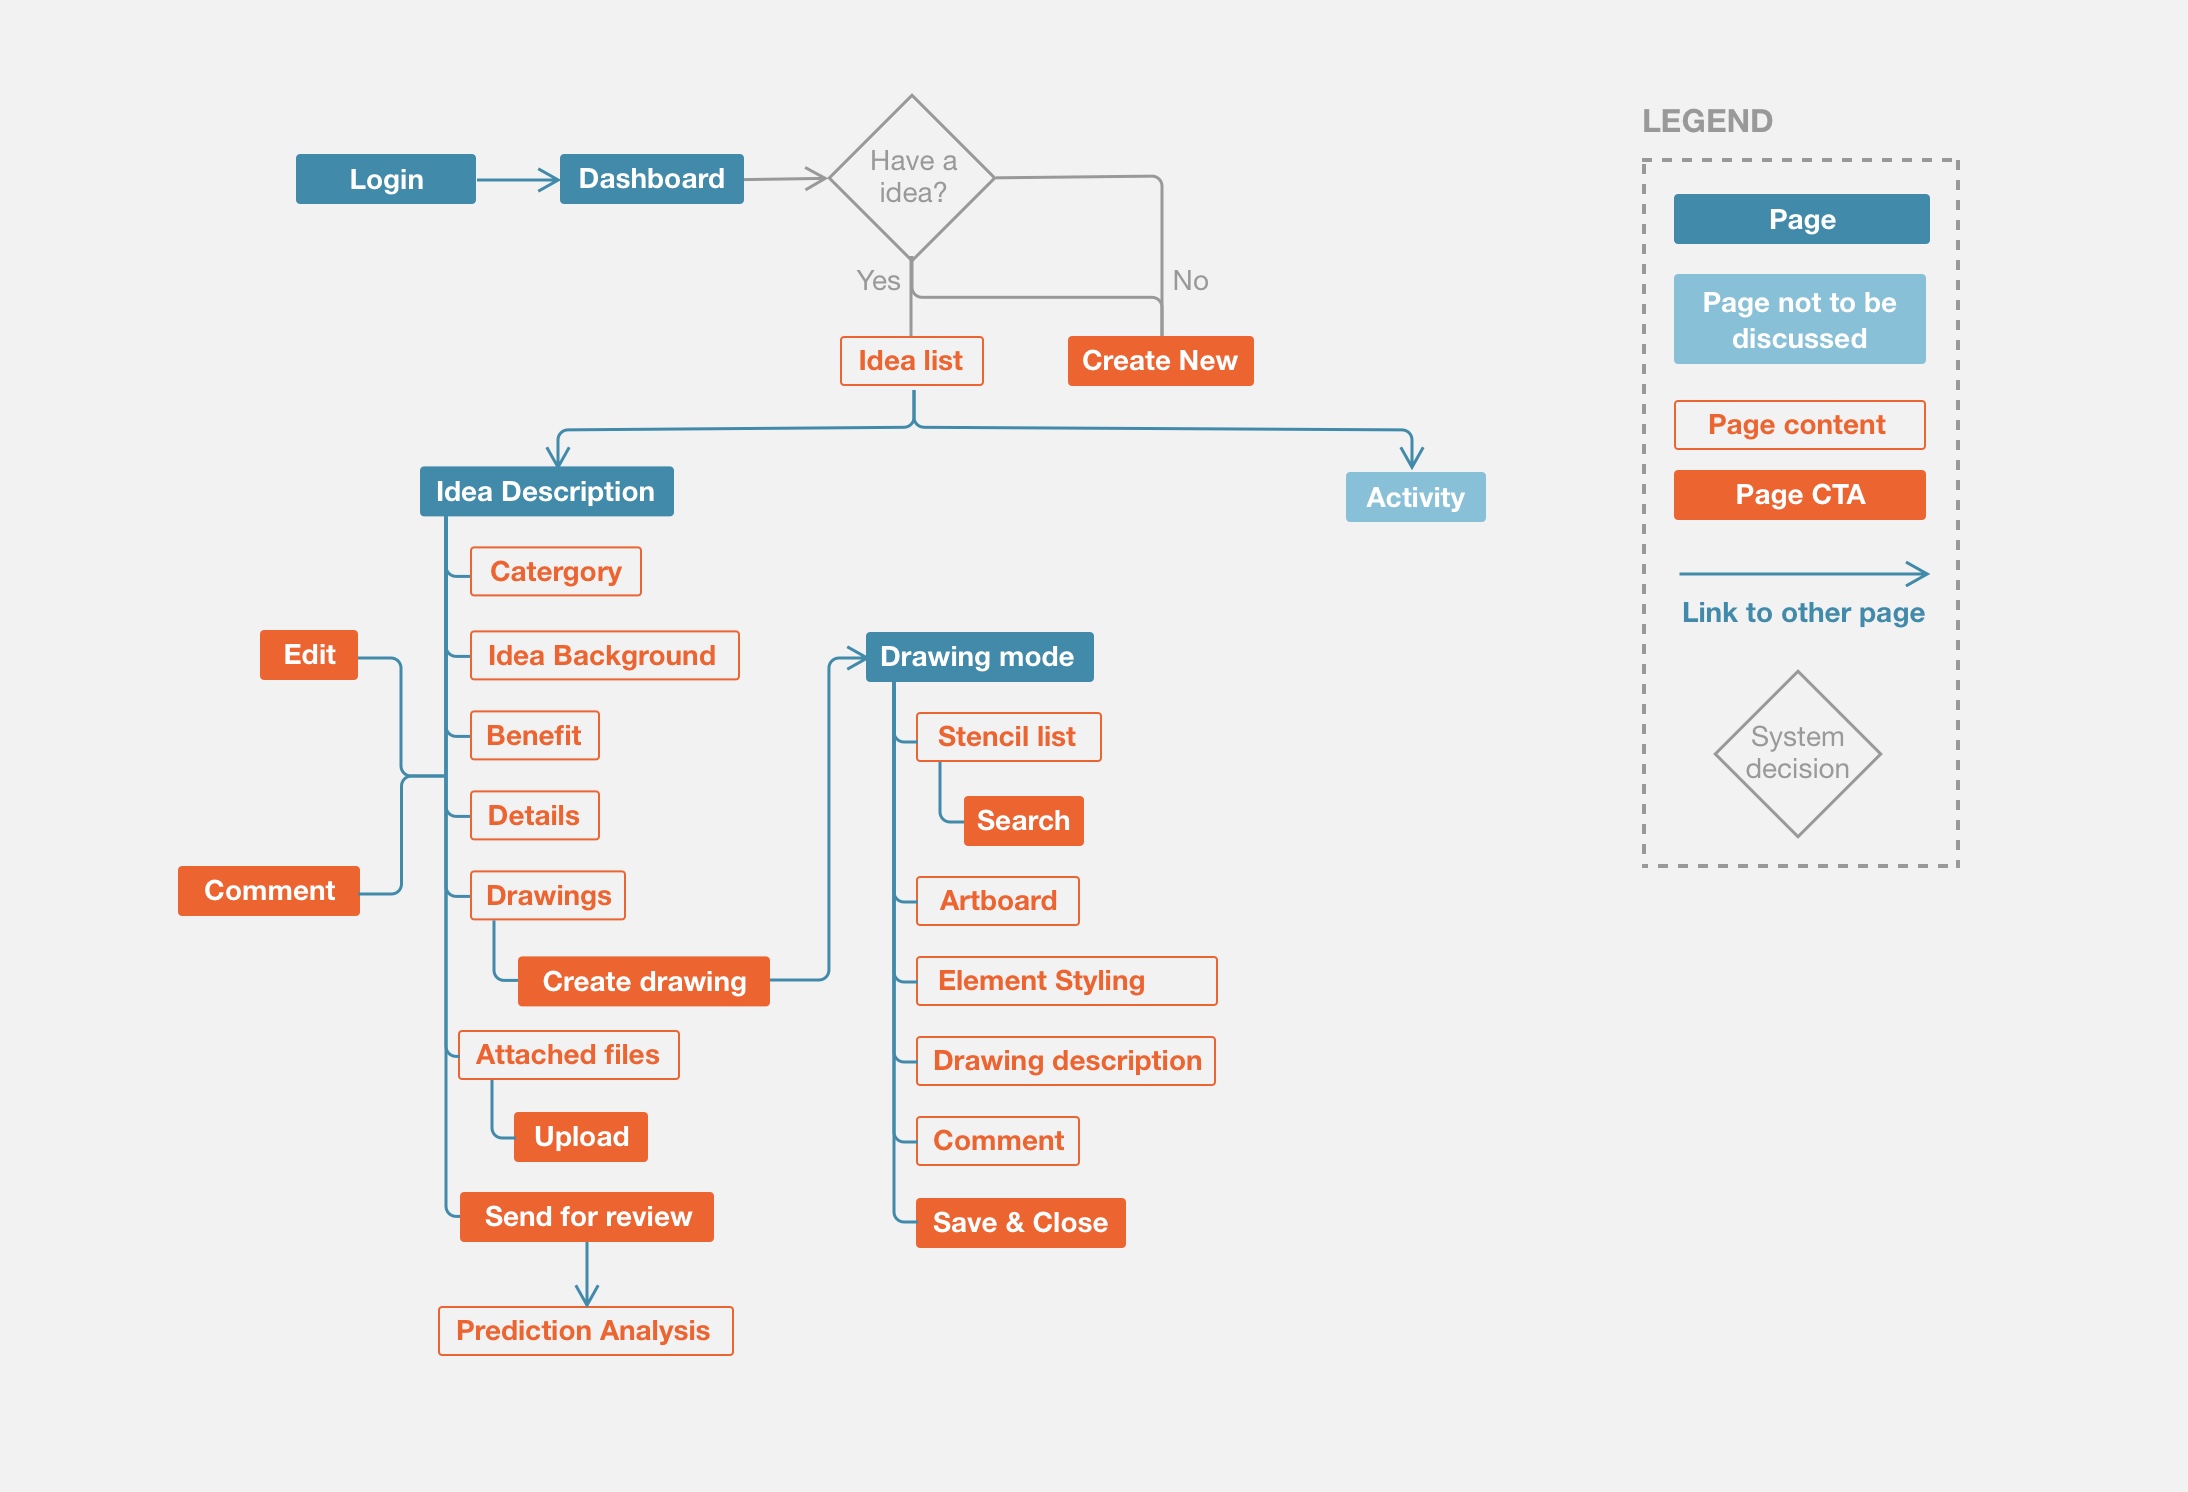
Information Architecture: After
— Process 4 of 4 —
Prototype & Iterate
Paper prototype
To make sure the redesign meets users' needs, I built the paper prototype. Then, I tested with five participants who are in either engineering or creative industry and have their own side-projects or startup. The cardboard was customized to provide a more smooth testing experience on paper prototype.
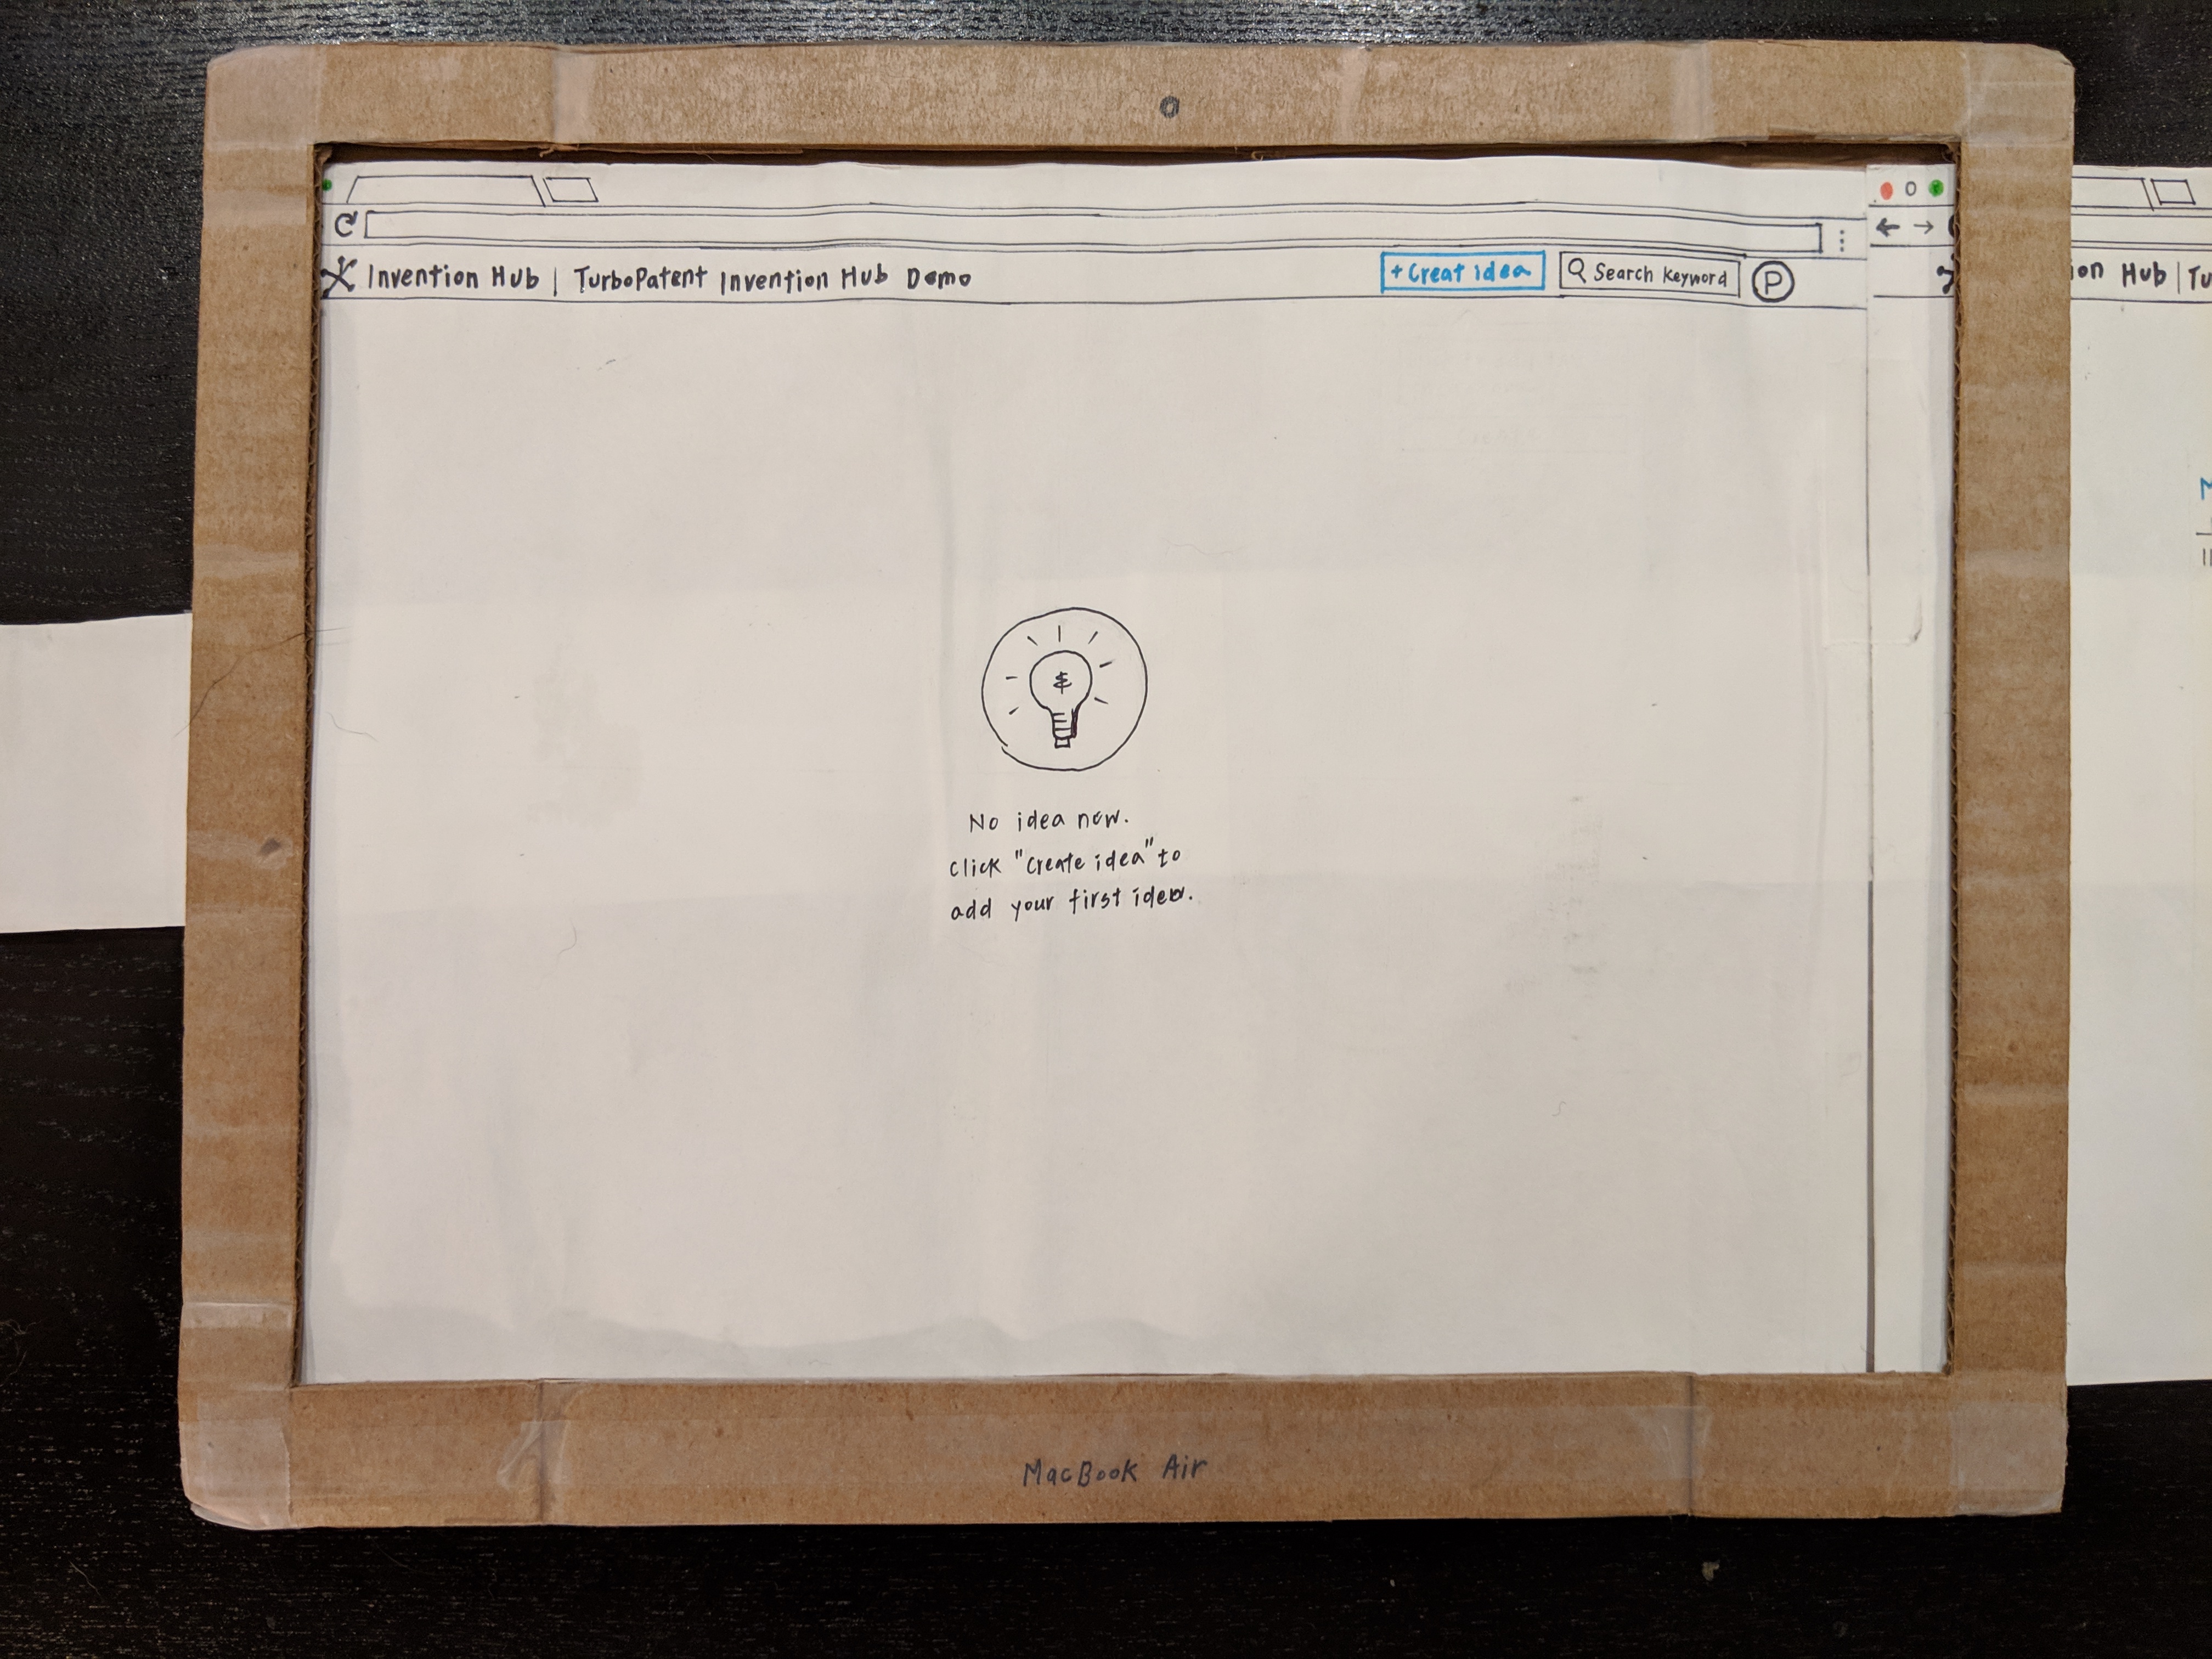
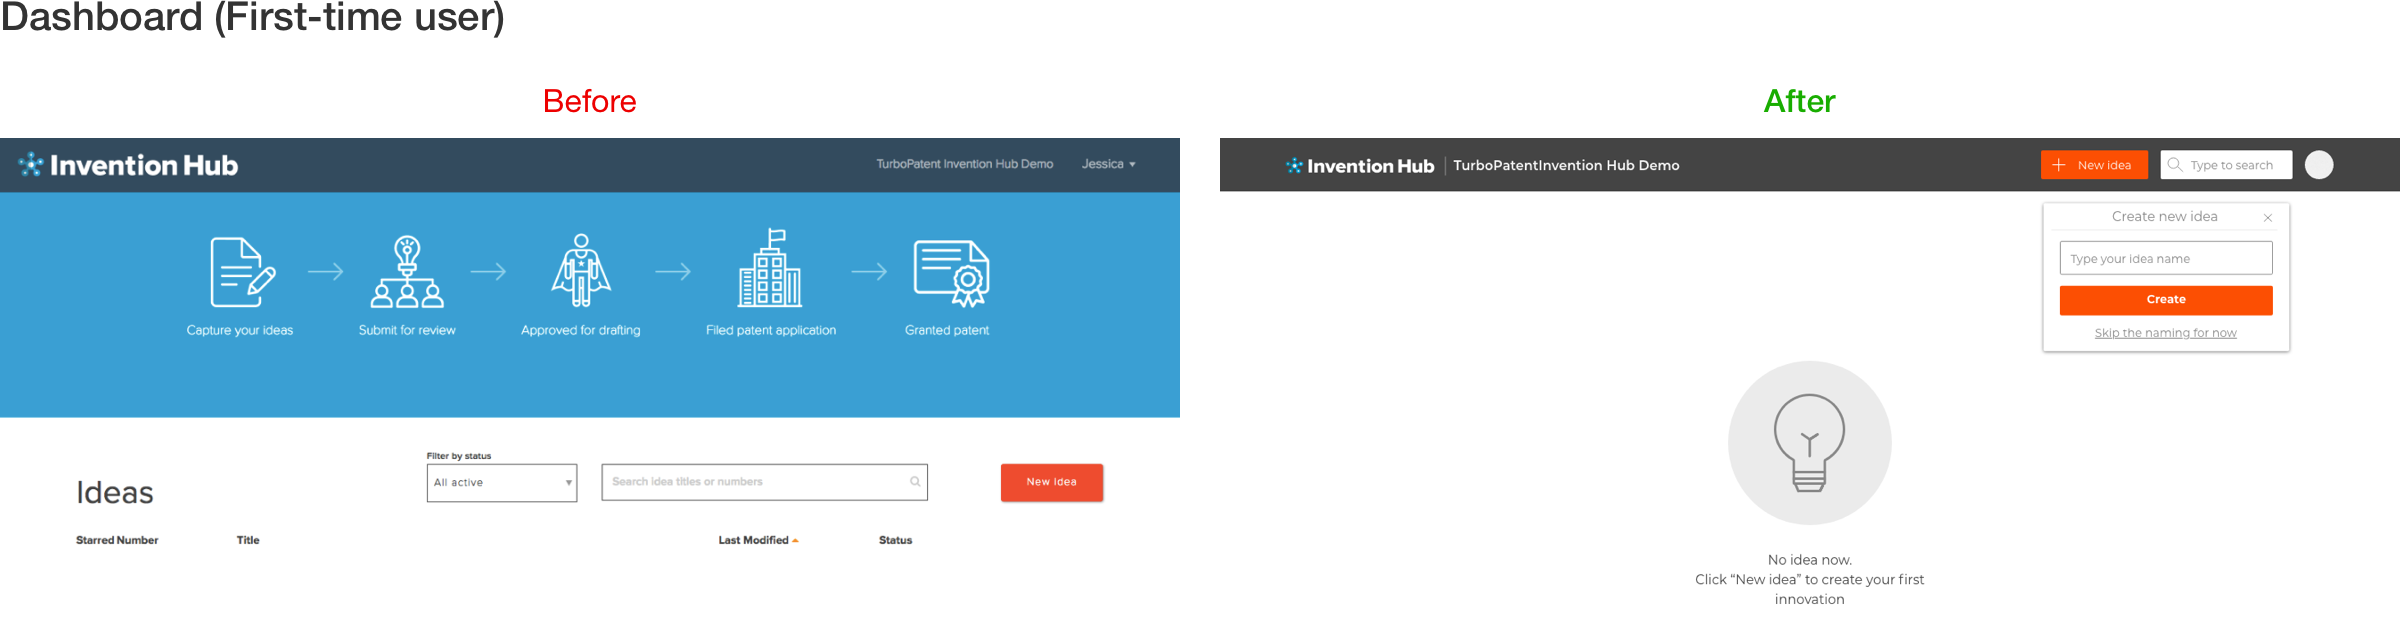
Dashboard page (for new users)
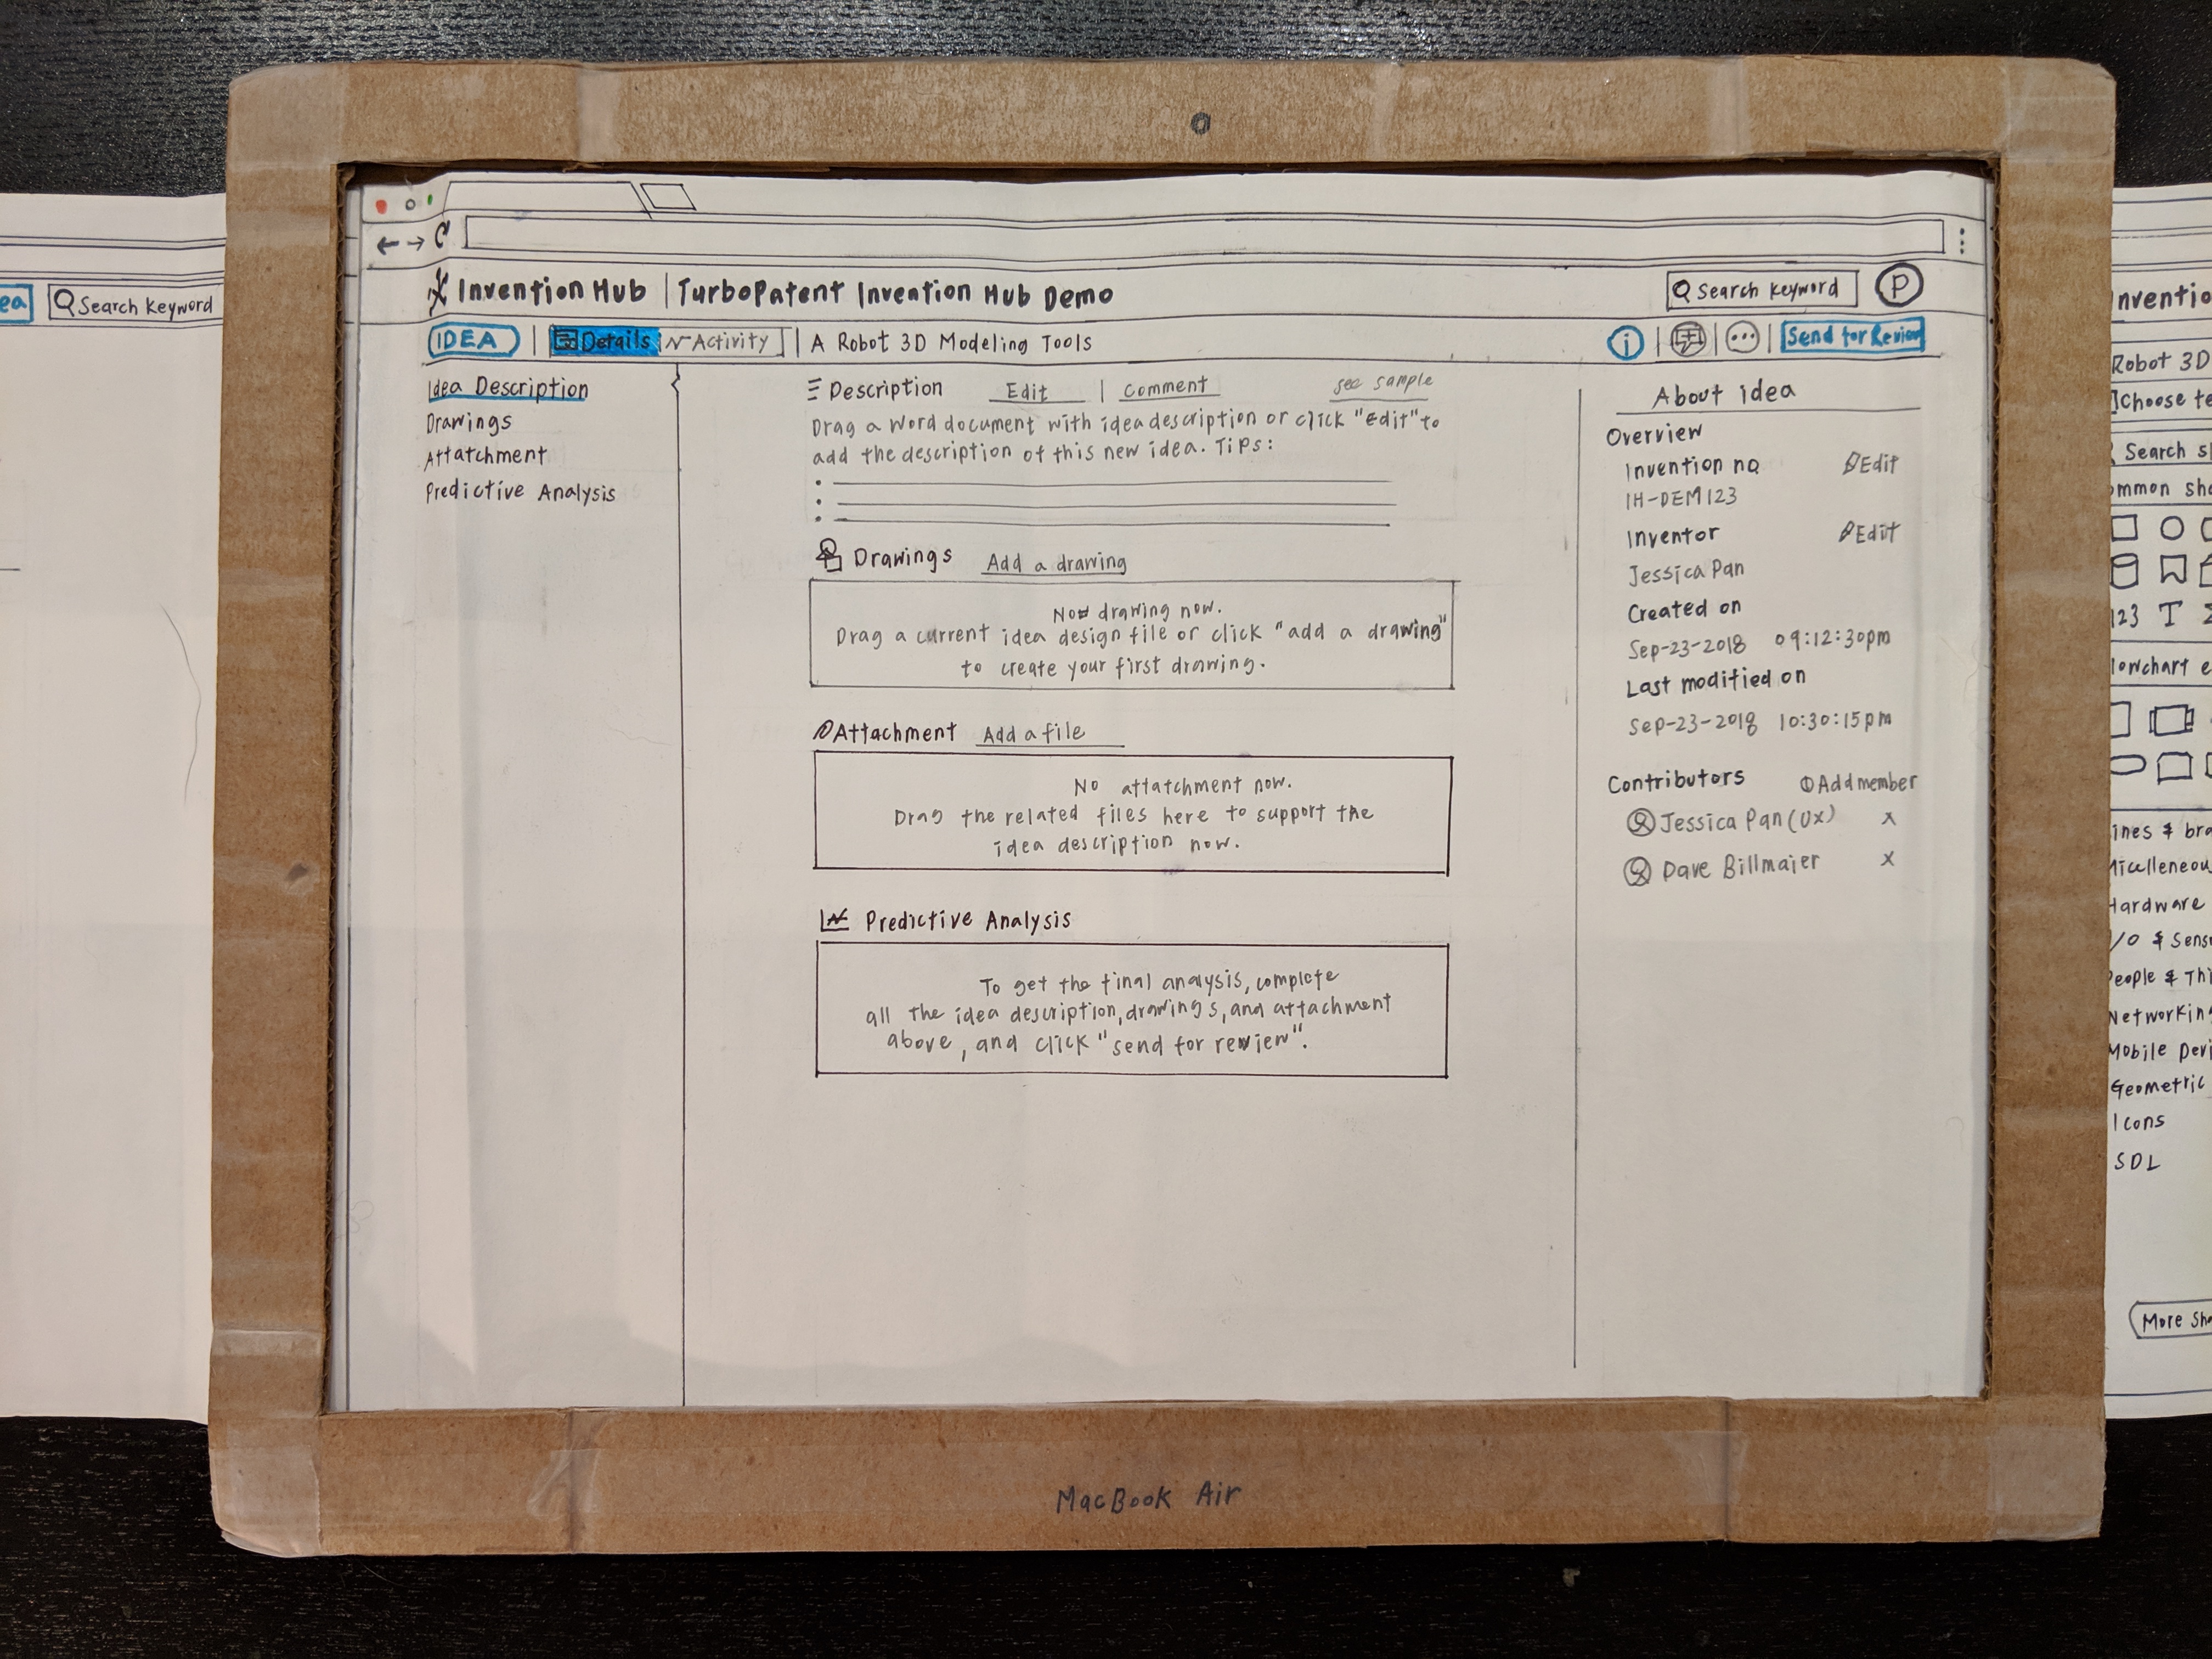
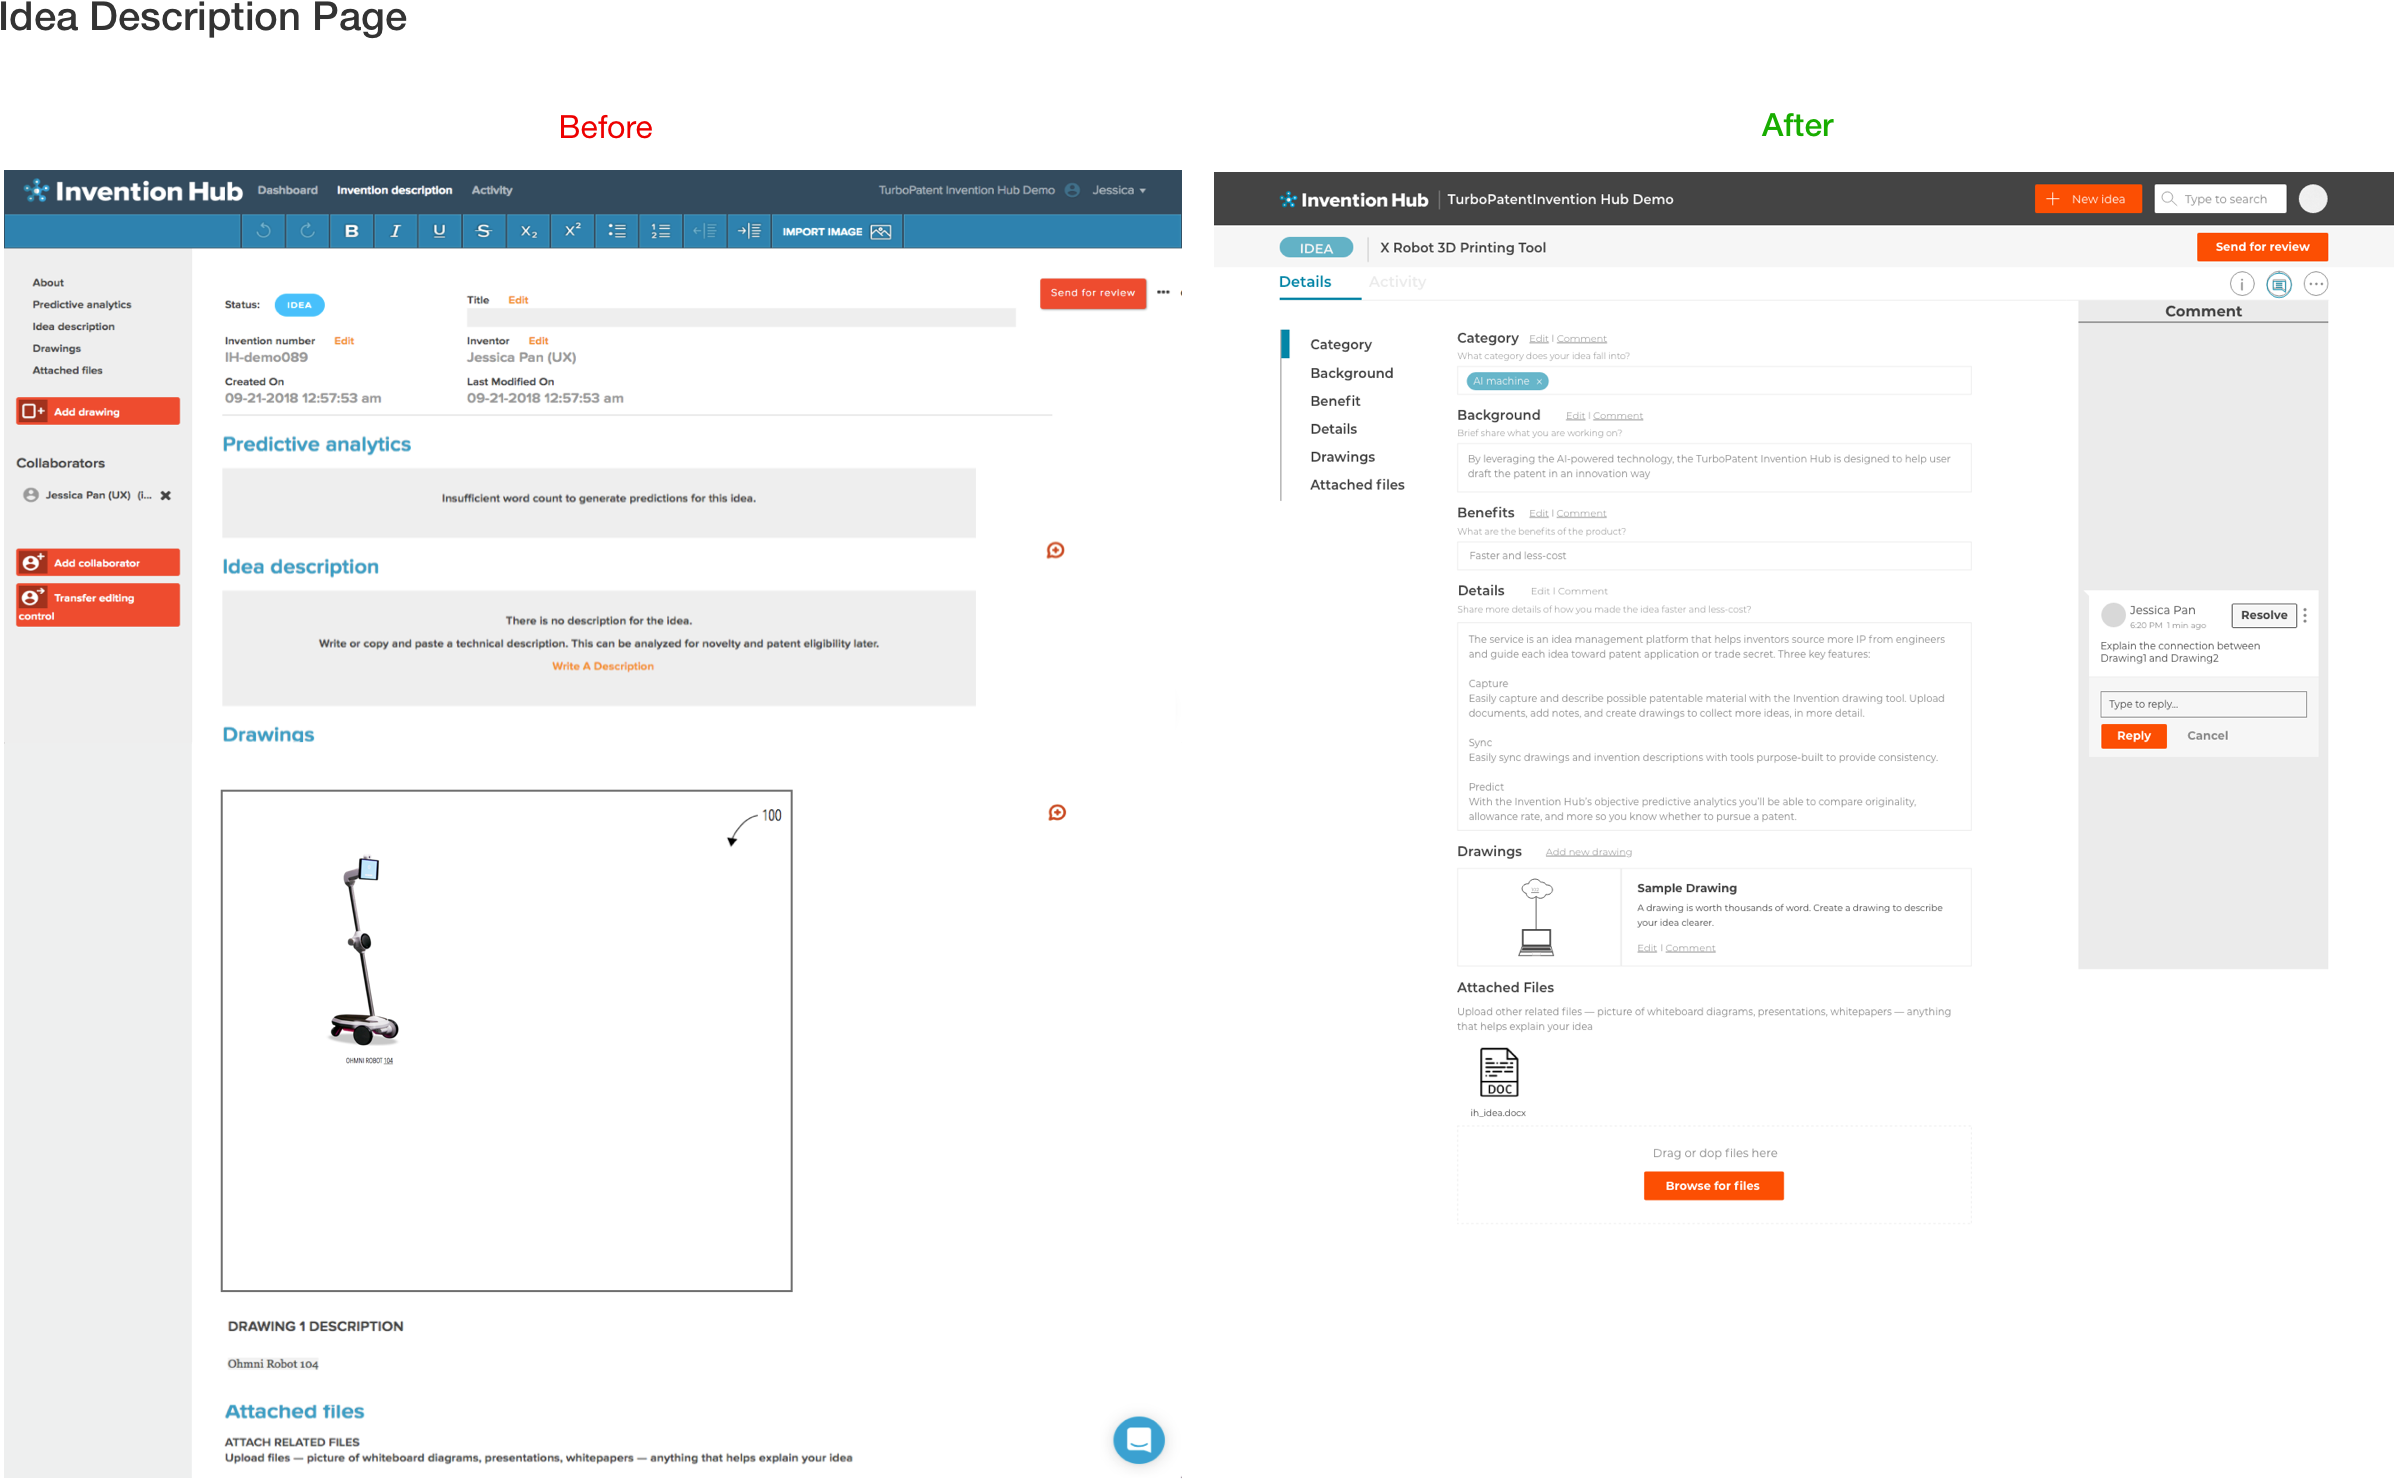
Idea Description page

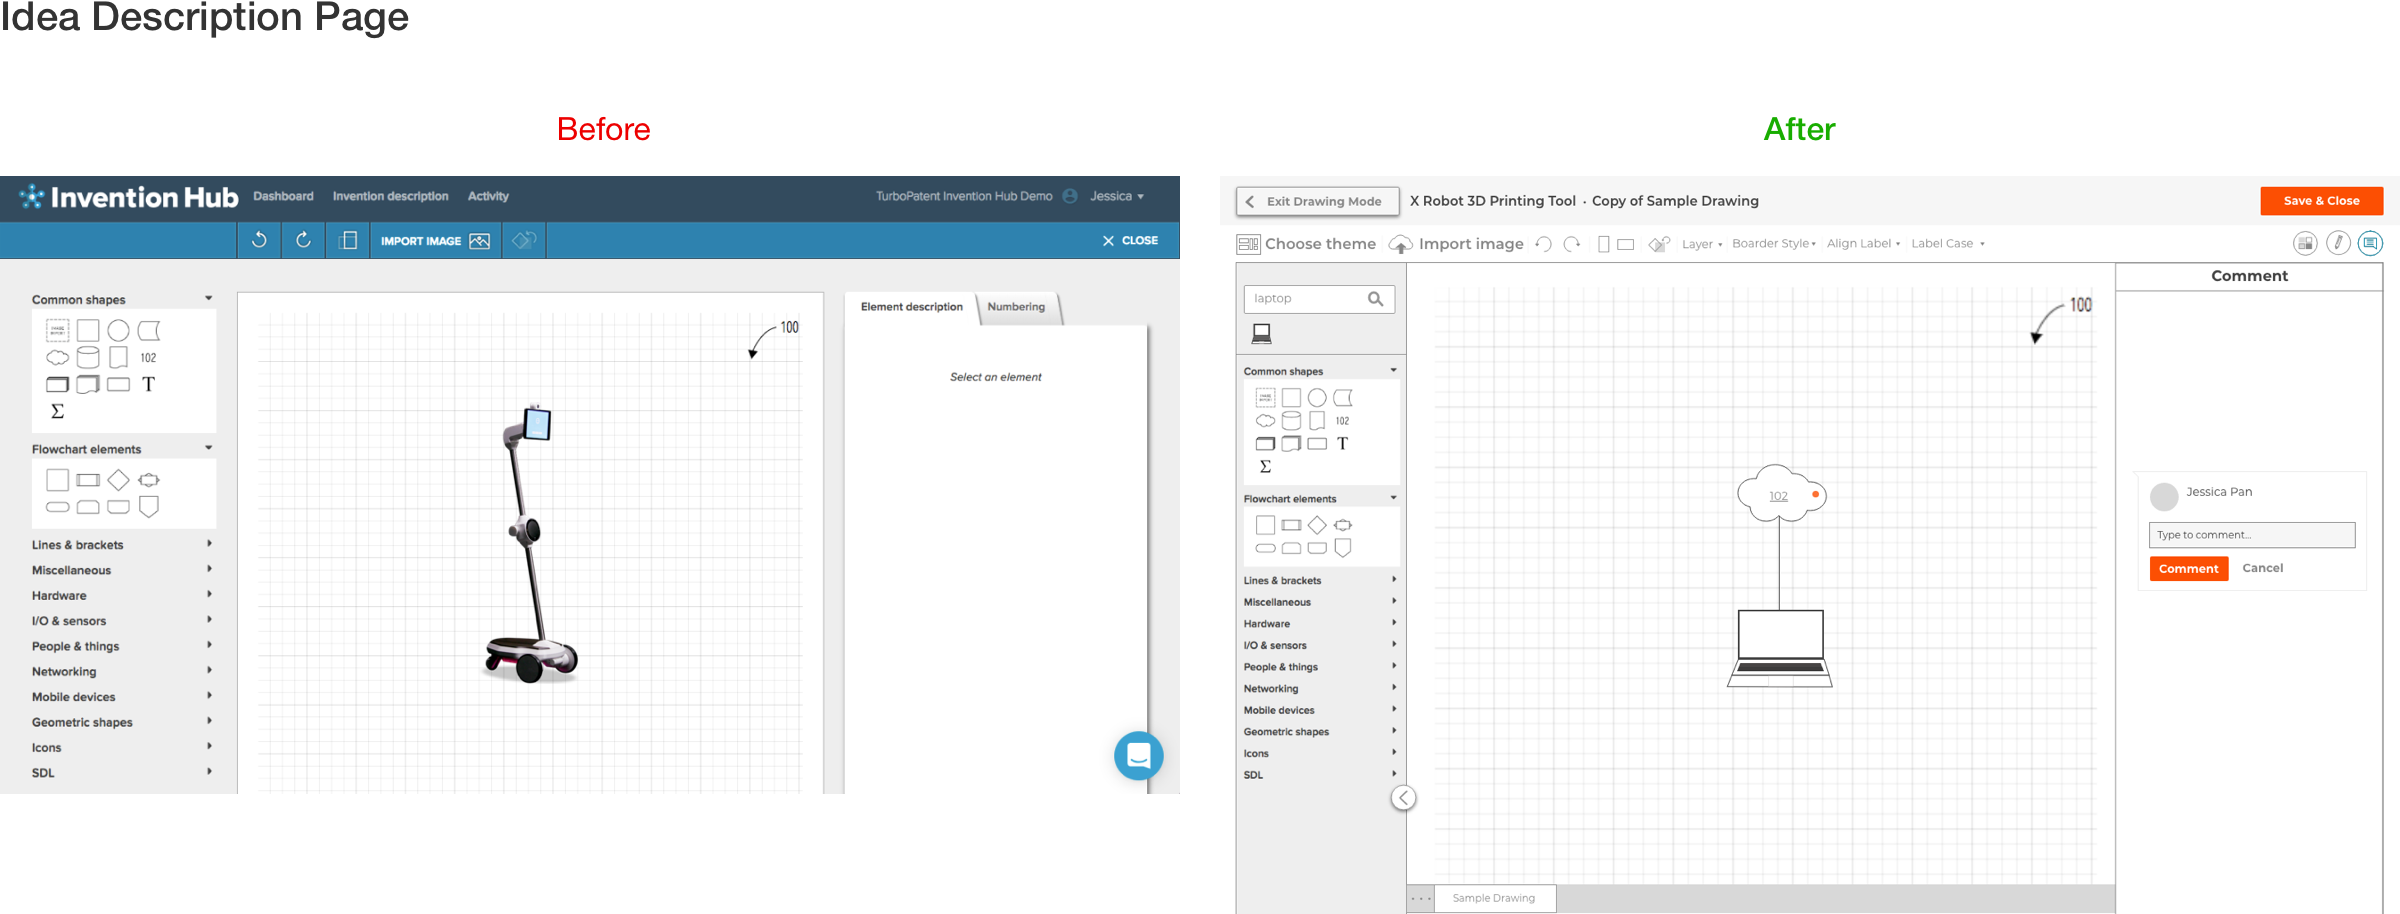
Drawing tool page
“It's an easy-to-use tool to capture my ideas and discuss them with colleagues and friends.”
Participant 3, Back-end Engineer
Prototype Testing
After collecting the feedback from paper prototype , I iterated the design and created the medium-fidelity prototype to conduct the prototype testing by following the Baseline Testing guide. The task completion rate jumped to 88%.
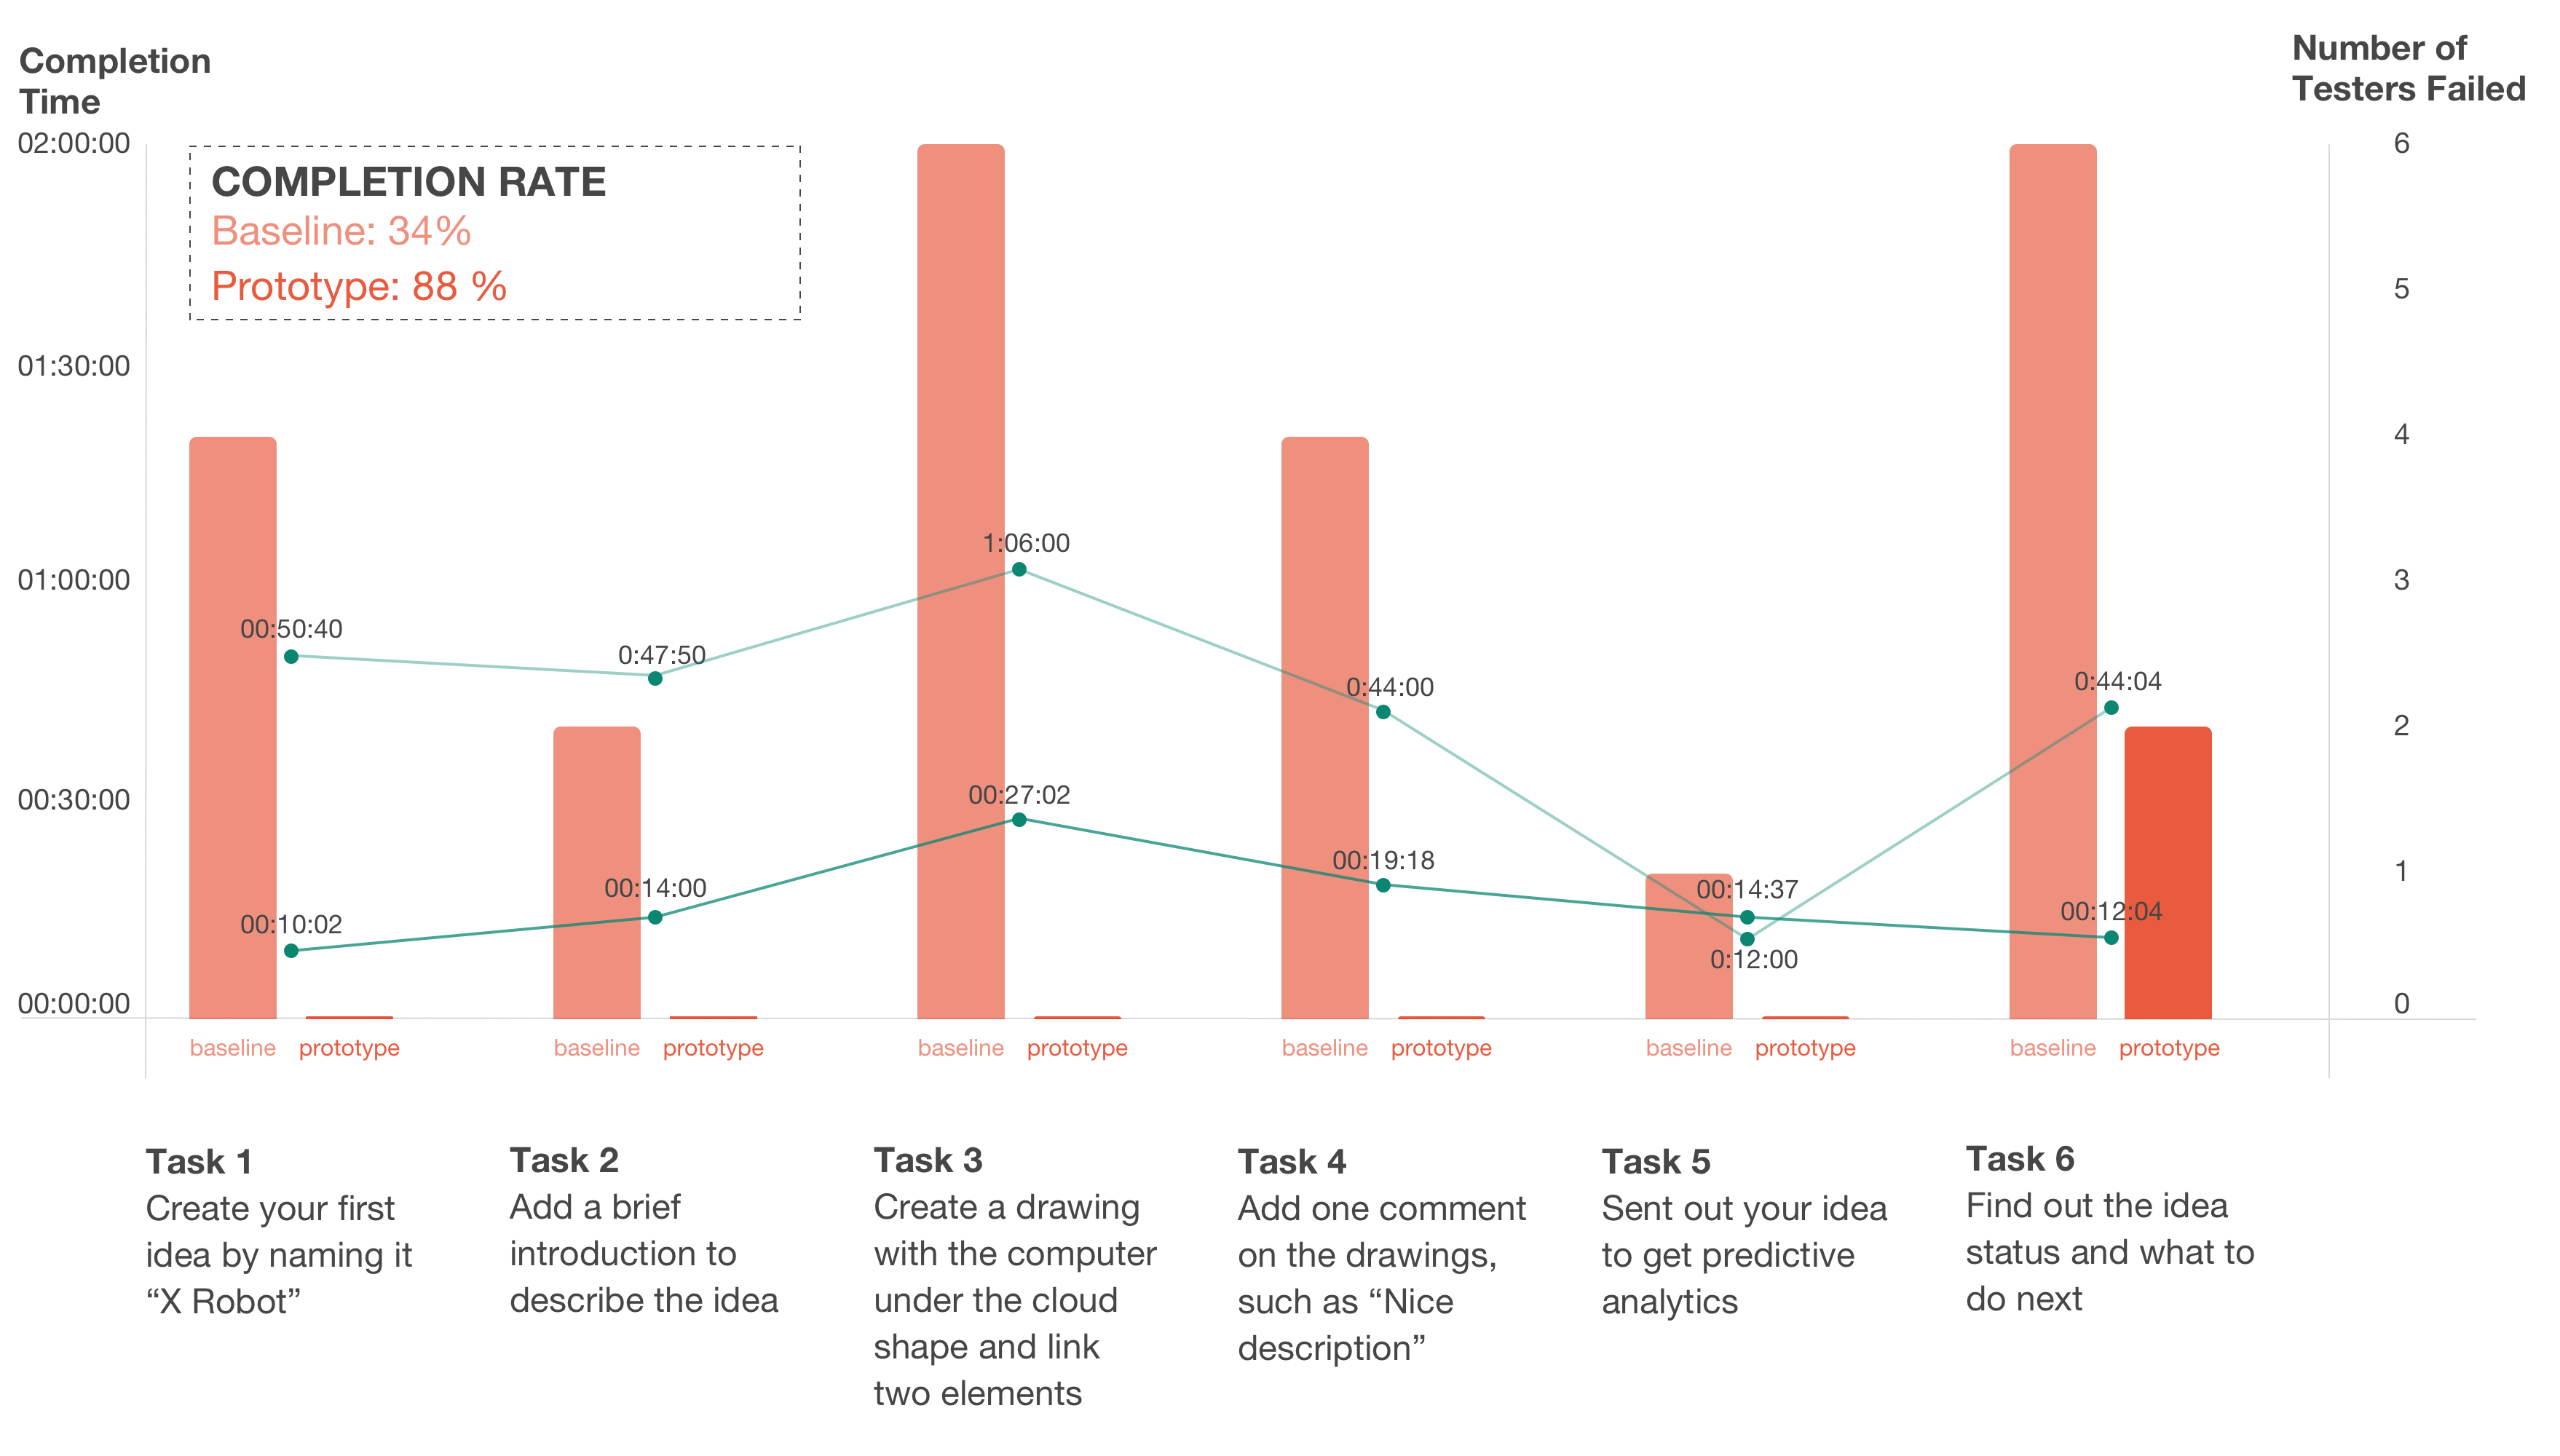
Comparison result of Baseline testing and Prototype Testing
SOLUTIONS
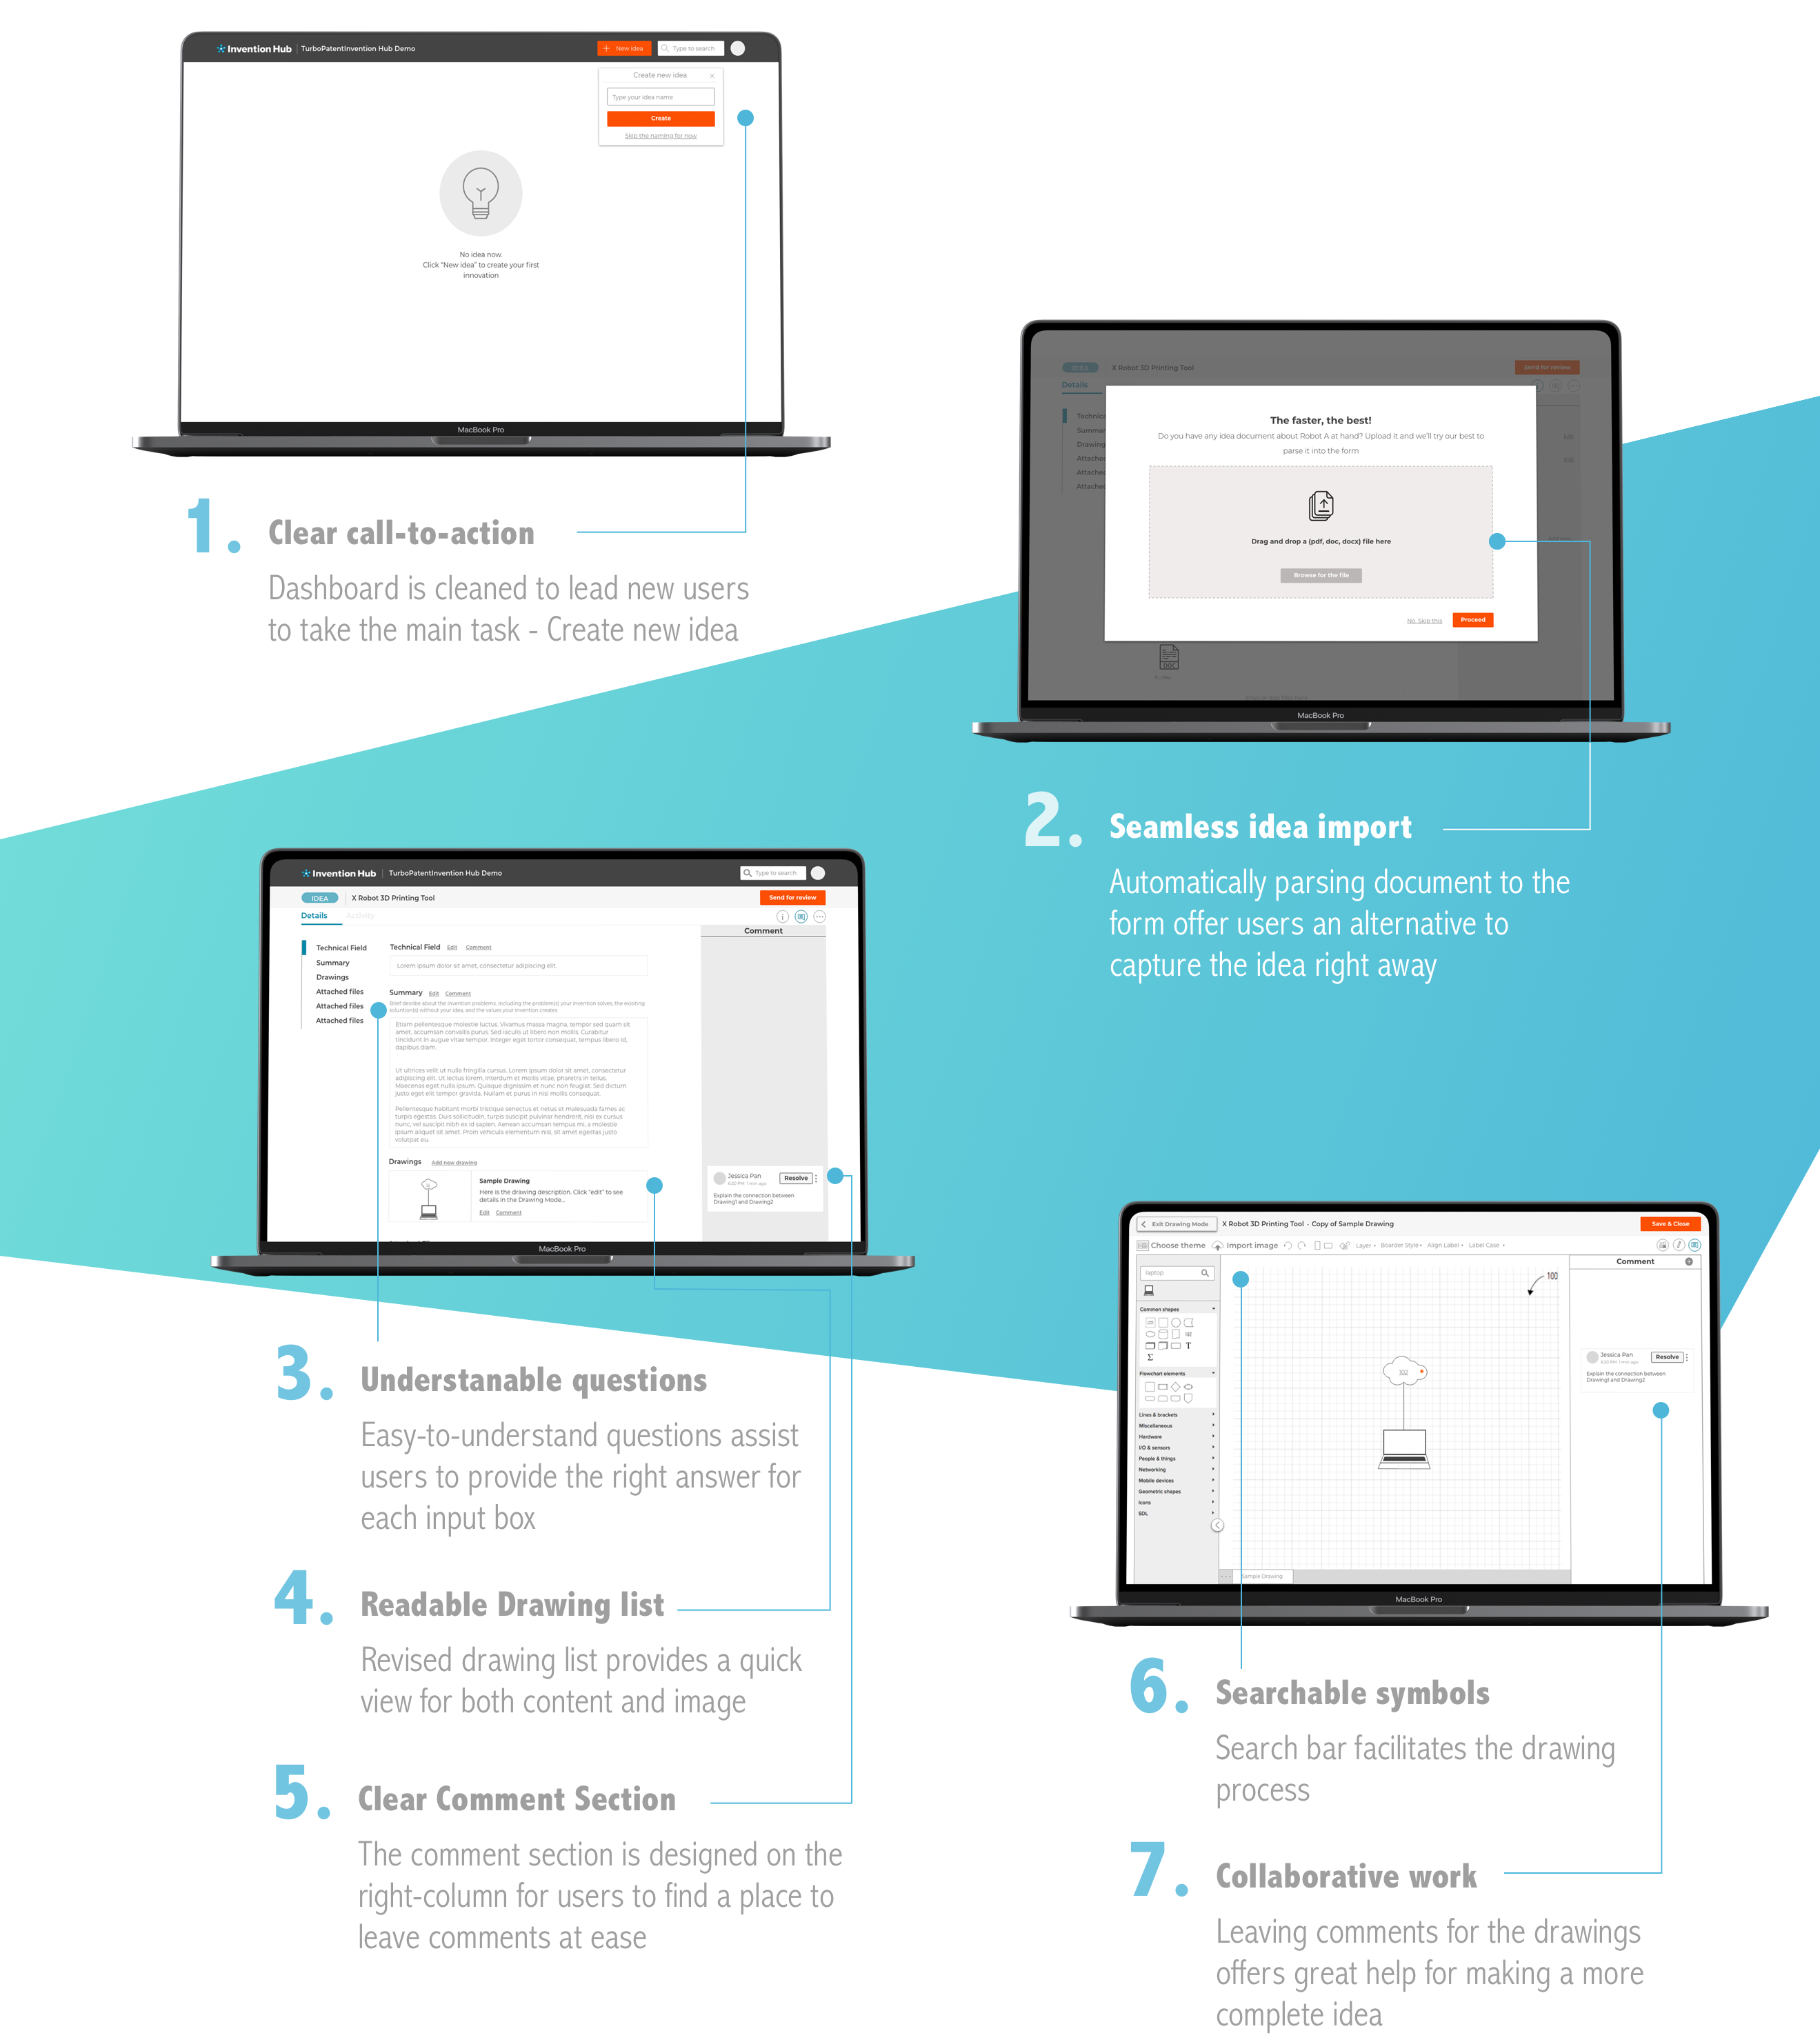
Features